Eleven winning line bets in a row for Sportpunter’s AFL Model

With the AFL at mid-season and each team having a bye, it’s probably about time that we also did a mid-season review of how the Sportpunter AFL Model is going. For those who have subscribed, you might well know why this review is taking place. Because no doubt, your bank balance should be sky rocketing.

To be frank, this year has been so far the best year for Sportpunter AFL subscribers. The results have been phenomenal. Even of late, since round 10, we have won 11 line bets in a row. The results of these are shown at the bottom of the page.

The results as shown here are proof for themselves. So far this year we have made 77 line bets for 50 wins at a 35% return of investment.  A staggering profit of $5,861 means that if you were betting with a constant $10,000 bank at say 1/5th Kelly, then you would have profited over $11,000 for the year so far. And we all know that many if our supporters have been betting more than that.

And why not? Because it isn’t just this year that the AFL Sportpunter model has performed exceptionally well, it’s been virtually every year. The last four years straight has seen us win over 13% ROI, and almost as big a profit as we have so far this year.

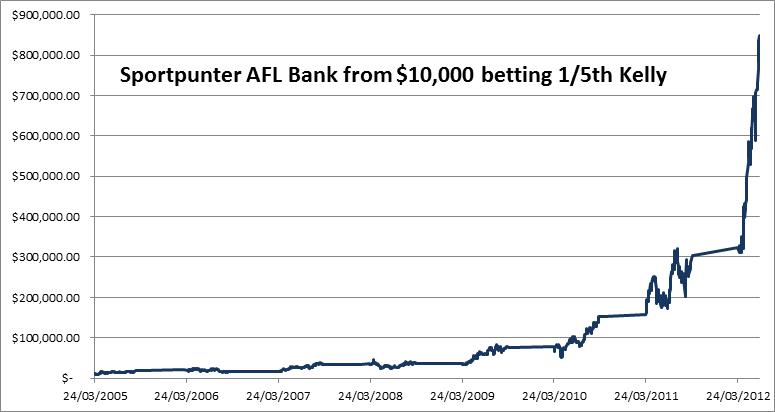
So big have the winnings been, that I’ve done some analysis if we had started with a $10,000 bank betting 1/5th Kelly back in 2005 and adjusting the bank after every 8 matches (a standard round).

The results are amazing. At the end of 2005, our bank would have increased to $19,263. Almost double. A drop in 2006 saw the bank decrease unfortunately to $16,158. However this drop was shortly reversed, with the bank more than doubling to $33,792 by the end of 2007. 2008 saw  a slight rise in profits to $35,549. And despite more than tripling our bank size four years, this is where the profits rake in.

2009 saw a doubling of the bank once again and it increased up to $76,315. It doubled again in 2010 up to $151,845. Doubling of the bank seems to be a common theme here, with 2011 almost doing it again. The bank at the end of the 2011 season hits $292,995. And in 2012 it has already more than doubled up to $848,655 with still half the season to go.

Of course this assumes that you can bet the full amount at the odds that we quote at the time given, but the theory is there, the results given and the profits recorded.

Can you really afford not to subscribe? It’s not too late to subscribe for the remainder of 2012. Click here for all the betting histories for AFL and here for subscriber information.


Eleven winning line bets in a row:

DateTeam1Team2ActualLine1ProbLineLineOdds1LineOdds2$BetLine1$BetLine2$Profit
02/06/2012EssendonMelbourne-6-54.534.8%1.951.95$-$285.68$271.40
02/06/2012Port AdelaideCarlton5419.559.7%1.951.95$172.79$-$164.15
03/06/2012BrisbaneWest Coast230.563.8%1.872.04$221.91$-$193.06
03/06/2012CollingwoodGold Coast97-64.562.9%21.91$258.00$-$258.00
08/06/2012CarltonGeelong-1214.555.5%1.921.92$71.30$-$65.60
09/06/2012EssendonSydney-4-9.540.7%1.911.91$-$145.75$132.63
14/06/2012West CoastCarlton10-25.532.7%2.021.88$-$301.41$265.24
15/06/2012AdelaideSt. Kilda4-17.540.3%2.061.85$-$122.88$104.45
16/06/2012Gw SydneyRichmond-1258.562.3%1.92.01$204.11$-$183.70
16/06/2012Gold CoastNorth Melbourne-736.560.8%1.981.93$208.00$-$203.84
17/06/2012HawthornBrisbane65-49.554.5%1.981.93$80.71$-$79.10

Posted in Model, Sport Models | Leave a comment

European Ice Hockey Model Analysis

The season for European Ice Hockey has finished, and what a great first season of betting at Sportpunter it has been. Head to head betting made 10% ROI, line betting 9% and totals 9% ROI since we started giving predictions in December. Whilst there hasn’t been a plethora of bets in each category (h2h: 208, line: 450, totals: 318), the consistent profits still stand for themselves.

But despite the low number of bets, it has definitely been a very profitable period, and there’s no excuse not to do an analysis of it, as it might come up with some interesting results; which as we shall see below, it does.

Firstly h2h betting:

Shown below is our tables of how we went, broken up into betting Home/Away, minimum overlay amount and betting per league.

Clearly we are betting on more home teams than away teams which is generally a good thing. But more pleasing is the fact that as the overlay increases, so does the percent return, which considering that the sample size is quite low, is good to see. It’s hard to break up which leagues are doing better than others because of the low sample size, but I’ve put that in there as well.

#Bets#Wins%Wins$Bet$Profit%ROI
Home1878344% $23,731.26 $2,389.53 10%
Away21629% $1,929.71 $78.784%
Total2088943% $25,660.97 $2,468.31 10%
Overlay#Bets#Wins%Wins$Bet$Profit%ROI
0.050.075421843% $3,042.80 $97.083%
0.0750.1512243% $5,086.41 $233.385%
0.10.15662741% $8,232.84 $465.776%
0.150.2301653% $5,379.72 $1,441.83 27%
0.20.419632% $3,919.20 $230.256%
2088943% $25,660.97 $2,468.31 10%
League#Bets#Wins%Wins$Bet$Profit%ROI
Austria - EHL20735% $2,568.18 -$259.60-10%
Czech Republic - Extraliga261558% $3,758.74 $1,084.61 29%
Finland - SM-Liiga21314% $2,040.80 -$583.17-29%
Germany - DEL542750% $6,417.17 $972.5515%
Slovakia - Extraliga16425% $1,951.29 -$332.75-17%
Sweden - Elitserien371951% $4,469.13 $1,528.98 34%
Switzerland - Nationalliga A261038% $3,602.11 -$318.11-9%
United States - AHL8450%$853.55$375.8044%
United States - NHL00$-$-
2088943%25660.972468.3110%

With more bets on line betting, the results seem even more consistent. Three quarters of the bets are once again on the home team, but both seem to be equally profitable. When the line is negative, positive or zero, we seem to profit equally around the 9% mark, which is indeed very pleasing. Profits were not made when the overlay was greater than 20%, however with only 49 bets ni this category, it is not something that I would look too much into.

#Bets#Wins%Wins$Bet$Profit%ROI
Home33616248% $43,109.09 $3,843.77 9%
Away1145952% $12,132.17 $963.068%
Total45022149% $55,241.26 $4,806.83 9%
#Bets#Wins%Wins$Bet$Profit%ROI
Favourite1477954% $18,466.86 $1,635.94 9%
Even2068843% $25,386.42 $2,330.21 9%
Underdog975456% $11,387.98 $840.687%
Total45022149% $55,241.26 $4,806.83 9%
Overlay#Bets#Wins%Wins$Bet$Profit%ROI
0.050.0751085854% $7,154.52 $1,239.61 17%
0.0750.11075148% $10,069.85 $596.186%
0.10.151165648% $14,268.25 $1,288.66 9%
0.150.2703753% $12,189.14 $2,089.44 17%
0.20.4491939% $11,559.50 -$407.06-4%
45022149% $55,241.26 $4,806.83 9%
League#Bets#Wins%Wins$Bet$Profit%ROI
Austria - EHL532445% $6,827.40 -$311.71-5%
Czech Republic - Extraliga472757% $5,686.76 $1,420.94 25%
Finland - SM-Liiga602440% $5,489.99 -$261.30-5%
Germany - DEL1015554% $11,049.09 $1,915.17 17%
Slovakia - Extraliga441841% $6,838.66 -$495.18-7%
Sweden - Elitserien542648% $6,587.92 $1,239.37 19%
Switzerland - Nationalliga A753749% $11,232.18 $767.677%
United States - AHL9556%$939.11$442.5447%
United States - NHL7571%$590.15$89.3315%
45022149%55241.264806.839%

Finally, and most interestingly, the totals. Clearly here, there is maximum value on the unders betting. A massive 19% ROI has been made betting unders from 155 bets. Betting overs actually lost a small amount of money. Even large overlays on the overs still lost, whilst unders gained profit in every overlay category. Clearly the unders odds are biased in our favour. Whilst the sample size is small for both unders and overs betting, history has shown on this website, that unders betting has and probably will be always more advantageous to bet than overs; no matter what the sport.

#Bets#Wins%Wins$Bet$Profit%ROI
Over1637244% $15,292.14 -$476.76-3%
Under1559159% $17,450.22 $3,355.88 19%
Total31816351% $32,742.36 $2,879.12 9%
Overlay#Bets#Wins%Wins$Bet$Profit%ROI
0.050.0751156355% $7,357.57 $1,106.48 15%
0.0750.1833947% $7,179.92 $323.565%
0.10.15693449% $8,583.12 $338.224%
0.150.2372157% $6,435.58 $1,298.61 20%
0.20.414643% $3,186.17 -$187.75-6%
31816351% $32,742.36 $2,879.12 9%
OverlayOver#Bets#Wins%Wins$Bet$Profit%ROI
0.050.075552851% $3,527.49 $229.246%
0.0750.1562443% $4,677.10 -$16.240%
0.10.15351440% $4,073.46 -$280.08-7%
0.150.215640% $2,588.81 -$196.74-8%
0.20.4200%$425.28-$212.94-50%
1637244% $15,292.14 -$476.76-3%
OverlayUnder#Bets#Wins%Wins$Bet$Profit%ROI
0.050.075603558% $3,830.08 $877.2423%
0.0750.1271556% $2,502.82 $339.8014%
0.10.15342059% $4,509.66 $618.3014%
0.150.2221568% $3,846.77 $1,495.35 39%
0.20.412650% $2,760.89 $25.191%
1559159% $17,450.22 $3,355.88 19%
League#Bets#Wins%Wins$Bet$Profit%ROI
Austria - EHL10550%$630.76$229.4836%
Czech Republic - Extraliga211257% $2,017.63 $287.2214%
Finland - SM-Liiga904449% $8,839.37 $231.813%
Germany - DEL331339% $2,321.22 -$346.65-15%
Slovakia - Extraliga311755% $2,730.56 $373.3114%
Sweden - Elitserien663147% $8,300.51 -$178.34-2%
Switzerland - Nationalliga A573867% $6,899.75 $2,633.18 38%
United States - AHL5120%$351.59-$226.30-64%
United States - NHL5240%$650.97-$124.59-19%
31816351%32742.362879.129%
Switzerland - Nationalliga A#Bets#Wins%Wins$Bet$Profit%ROI
Over4125%$304.93-$177.91-58%
Under533770% $6,594.82 $2,811.09 43%
Total573867% $6,899.75 $2,633.18 38%

But almost all of this profit was gained in Switzerland’s National A league. This is very interesting. Whilst the average across of the leagues totals scores was 5.33. Switzerland’s was only slightly lower at 5.27. The average totals line across all leagues was actually 5.27 as well, but in Switzerland’s case it was 5.44. And there is what lies the advantage.

Whilst it could be random variation that the Swiss provided the majority of the profit from its 57 bets, it must be noted that even not taking into consideration of this league, 5% ROI was still made betting the unders in the other leagues.

I wouldn’t put all your eggs into the Swiss basket at this stage, we simply dont have enough data to determine if the edge in this league is bigger than the rest. But at least, keep it in the back of your mind for the end of seasons analysis next year.

Full betting history and European Ice hockey information is given here. Predictions are free.

Posted in Model, Sport Models | Leave a comment

We’re back online!

Yes it’s been about a week, but it’s been a hair pulling teeth grinding week indeed. You see, stupid dirty hackers decided to hack into my website and shred it to pieces. I hate hackers. I mean what is their point? At least I can take the honour of being a big enough website for someone to hack into!

But look at the bright side. Aside from my website being down for about a week, I’ve managed to change to a better host, and have a more secure website and can easily look out for these issues with greater scrutiny. It’s been a good 5 years since my friend pleaded with me to leave DotEasy hosting. And I’ve finally done it. But when they decided to take down your website and not even notify you of doing so, well that was the last straw.

This is a shout out review of anyone wanting to go to doteasy webpage hosting, to stay well clear.

Enough of the rant. So what now for Sportpunter? Well it is our 10th year in the business, and there are plans for a get together / function later in the year, perhaps in the weekends of the prelim finals.

Soccer predictions have started up each week with mixed results, and are as always a work in progress. AFL betting has had another blinder of a weekend, with three massive bets getting up quite easily on the line. This year alone we’ve made almost $2,000 and 37% ROI betting on the handicap. Just a small bank size of $2,500 at 1/5th Kelly would have already paid for the subscription price and we are only in round 3! And that doesn’t even include the 21% ROI made on totals betting to date.

Since November last year, betting on European Basketball has made 8.4% ROI from over 1000 bets betting on the totals, 6.1% ROI betting on the line, and 2.7% ROI betting head to head.

College Basketball finished up 2.0% ROI betting totals for the year from over 1200 bets. A bit lower than previous years, but still positive nevertheless after a great start to the season.

Despite not having many bets since starting in December last year, College Basketball has made 8.8% ROI from 318 bets betting totals, 9.7% ROI betting head to head and 8.8% ROI betting the line from 450 bets.

I have identified a new variable in tennis (I can’t say what it is, as in doing so will lose its value), that even when blinding betting, you could make as much as 3-4% ROI. This will be shortly added to the models.

And yes, I know it’s what you have been waiting for, but an Australian Horse Racing model is on the agenda, and should be up and running before the spring carnival.

Either way, we are up and running just like normal. So come on in, chat in the forum, view the free predictions and bet like a professional once again.

Jonathan Lowe

www.sportpunter.com

Posted in News, Sport News | Leave a comment

GWS Giants – how will they fare when compared to Gold Coast?

gwsydneygiantsThe opening match between Greater Western Sydney Giants and the Sydney Swans looks to be a very interesting betting game indeed. No one is really sure how to rate the Giants, except for the fact that the Swans will make them look like midgets.

But interestingly, the amount that the books believe that the swans will give the giants a hiding for is greater than any match played by Gold Coast last year. The current line for the Swans Giants game is -90.5. Meaning that the Swans have to win by at least 91 points to cover the line.

The biggest line offered last year for newly formed Gold Coast in 2011 was -88.5 when they ventured down to Simmonds Stadium to play would be premiership team Geelong. The average line that the Gold Coast had last year was -49, but here we are opening with a lot bigger line.

So are GW Sydney tipped to be a worse team in 2011 than Gold Coast in 2012? Yes I think so. But is that really warranted? Let’s compare pre season results to determine that:

Gold Coast pre season 2011:

West Coast 12 15 87 Gold Coast 6 11 50 Patersons Stadium
Gold Coast 3 5 23 Sydney 14 11 95 Metricon Stadium
Brisbane 17 20 122 Gold Coast 7 12 54 Gabba

So a fairly average opposition with teams playing against the Gold Coast finishing 4th, 7th and 15th. The average losing margin was 59 points. Let’s compare this to GW Sydney in 2012:

Hawthorn 14 18 108 GW Sydney 4 10 34 Aurora Stadium
GW Sydney 11 10 76 Gold Coast 9 6 60 Blacktown Park
GW Sydney 9 12 66 Richmond 20 20 140 Manuka

So a similar opposition as well, with top 2 favourite Hawthorn, vast improver Richmond and lower of the ladder Gold Coast. The average losing result here is 55 points.

So the preseason records of both teams is comparable.

But everyone remembers that opening (round 2) game of Carlton vs. Gold Coast last year where Carlton spoiled the AFL party to win by 119 points when the line against Gold Coast was just +26.5. It was a very underdone Gold Coast, with all of their senior players being very underdone. Brennan and Brown could only muster 22 possessions between them and Ablett had not played a pre season match and looked match unfit compared to normal. However this week GW Sydney’s main gun Scully is out with a cheekbone fracture.

Perhaps there is a case, that new formed teams, like Gold Coast and GW Sydney will start poorly and then improve as the season goes on. This happened to Gold Coast didn’t it? Let’s find out.

Gold Coasts average losing margin was 54 points over 2012, and the graph below shows their progress. Many will have forgotten that they actually won 2 of their first 6 matches, and the trend for their performance did improve over the season as shown by the linear regression line (but keep in mind that Hawthorn did play only half a side in the final round of the season)

What can be more interesting is finding out how Gold Coast went against the line in 2011. The average line for Gold Coast was +49 with the smallest being +17.5 against Brisbane in round 21. But how they went against the line is interesting as shown in the graph below:

So it seems, even against the Line, Gold Coasts results in 2011 did increase, although as pointed out below, this is minimal if you don’t include the last match versus hawthorn:

What is also interesting is how my ratings for Gold Coast went in 2011. Shown below is Gold Coasts ratings over the span of the year:

So not a huge improvement, but clearly the form of Gold Coast improved as the season went on.

So what does this all mean? Well I guess is means that we could possibly expect the same from GW Sydney. They might well start off slow, but then improve with a few games under their belt. Perhaps the bookies have the Giants with the correct line of +90.5 considering this. But that said; remember it is bigger than any line last year against the Gold Coast.

Make sure you read up about our previous article about how well we did betting on the Gold Coast last year, as well as checking our betting history over 13 years, and subscription options.

Posted in Blog, Gambling Blog | Leave a comment

Supercoach pre season NAB Cup results 2012 – Excel

For those who love a bit of supercoach, the followin is a link to Supercoach in excel format, which also has points per game, time on ground and points per minute for every player – Sortable by whatever method you feel.

Supercoach 2012 NAB cup scores

And for those not in the know, I am offering a free subscription for AFL 2013, if you can beat me in this years superoach. Sign up using the code: 232722

And it would seem that the above league is full! So if you join this league (division 2) then the winner will get a free NFL 2012 subscription. Use the code: 241926

Also, whilst you are here, fill free to view our betting success over the years as shown here, and subscription information here.


Posted in News, Sport News | Leave a comment

AFL Goldmine season set to start 2012

Season proper for the AFL begins this weekend, with new team Greater Western Sydney to play the Sydney Swans. More about these teams later, but first let’s talk about the success of the Sportpunter AFL model, clearly the best model that Sportpunter operate.

The record speaks for itself. Thirteen years of history summing up to a profit of 10% ROI for head to head betting. That means that for every $100 you bet, on average you return $110. And when you start making many bets each weekend, the profits rack up. Line or handicap betting has been amazingly strong the last few years. Here we’ve made over 15% ROI over the past three years.

We also started totals betting last year, which started slow (2.2% ROI), but we have tweaked it a little and expect great results this year.

One of the keys to the AFL model is being able to judge the teams very accurately, more accurately that the bookmakers or any other source. With Greater Western Sydney coming into the competition this year, I have no doubt, that we already have good grasp of how they will go.

Because what we can do is take a look at how we did betting for or against Gold Coast in 2011, who were the new introduced team.

Gold Coast was a pot of Gold.

Given 15 bets for or against them, we managed to win 13 of them, with the two losing bets amongst the smallest size. $3262 was bet for $2561 profit or 78% ROI whenever the Suns were involved betting on the line. Head to head betting saw us bet on them twice for one victory and against them five times for five wins. $2465 was bet for $681 profit or 27% ROI.

Does the public think they know how good the Giants are going to be? I don’t think so. More than half our profit betting the line was made betting on or against the Suns in 2011, and with the Giants starting up, there is no better time to get involved with Sportpunter’s AFL Model.

You can view all the betting history here, and feel free to drop me a line or ask other subscribers in the forum about the subscription.

But get in quick, because the Giants start their season off this weekend, and you don’t want to miss out.

Subscription details are available here.

Best of punting luck

Jonathan Lowe

www.sportpunter.com

Posted in Model, Sport Models | Leave a comment

Debunking the debunking of the Kelly Criterion

Recently one of my potential clients pointed out a website that claims to debunk the Kelly criterion. For those that don’t know the Kelly criterion is a money management strategy that works out how much you should bet on a sports outcome based on the probability of the team winning, the odds that the team are at and your bank size.

It is not the first time I’ve noticed the article on http://professionalgambler.com/debunking.html as the article has been up there for quite a while. Several years ago another of my friends said it was “embarrassing for the bloke” that the article was still there. But considering that I highly use the criterion in my betting, I hate to have potential clients find articles that criticise the method that I use. Well, they have every right to criticise me, but when they get it completely wrong, that’s where I come in.

So this is my article, debunking the debunking of the Kelly criterion

PG, for short, suggest that we get a couple of decks of cards and do a test. That’s so old school. I’ll do the same thing with a statistical simulation. Using exactly his test, but I might do it say, 50,000 times instead. Computer programming is handy you know.

And guess what? The results actually favour PG’s argument. When betting with the Kelly criterion the average bank size after 100 bets was $49,320.70, up quite a bit from the original $10,000. When working out how much each bet was using the average size bet of the Kelly criterion, the average finishing bank size over 50,000 simulations was $53,763.75. In fact 65.7% of the results favoured PG’s flat betting strategy.

So perhaps PG is correct, we should all be flat betting no matter what? Not so. You see PG decided in his article to compare the average size of all the Kelly bets and bet the same amount flat betting. That sounds all very good, but in reality you have no idea what your average bet size is several years into the future.

To show why this method doesn’t work, I will do another simulation where instead of just betting 100 bets (which one could easily do in a day or two), but with 1000 bets.

The results are incredible and obviously not realistic, but they are there to prove a point. The average finishing bank using the Kelly criterion was just over $100 Billion, whilst the average flat betting strategy was just over $1,000 Billion, or 10 times the size.

Seems like the flat betting wins again yes? No. Because the average size bet for flat betting was $288 Million, which considering that you only have a $10,000 bank is pretty impressive.

The comparison is assuming that even with a $10,000 bank, that you are going to bet $288 Million each bet, and if you lose your original $10,000 (which you could do on the very first bet), you just keep going betting $288 Million at a time.

Quite clearly, the comparison is not legitimate.

You see PG doesn’t seem to understand what exactly the Kelly Criterion is. The Kelly criterion suggests that you bet more when the probability is greater, you bet more when your advantage over the bookmaker is greater, and you bet more when you bank size is greater.

He incorrectly labels this a progressive betting technique when it is far from it. Lets look at each criteria in the Kelly betting system.

You bet more when the probability is greater. If something was a 99% chance to win, you surely would bet more than if something was a 1% chance to win. Id hate to be risking 5% of my bankroll on a 200/1 shot. PG probably has never thought of this in this case, because like a lot of Americans, he only bets on the line where something is around a 50-60% chance to win each time.

You bet more when your advantage over the bookie is greater. Surely if you rated a team a 90% chance to win and they were paying $2.00, wouldn’t you bet more than if you rated a team a 50% chance to win and they were paying 2.01?

It seems that the only thing that PG doesn’t like about the Kelly criterion is the fact that as your bank grows larger (or smaller) then you bet more (or less). Incorrectly calling this a progressive betting system, the reason why one should adjust their bet size based on their bank size is given by a few examples.

Remember when you were young child and you would save all week to go down to the corner shop and buy a $1 bag of mixed sweets? Would you do the same now? Save all week to buy some sweets? Of course not, now that you are more wealthy, you spend more. You could save all week to buy a TV or a dining room table that would cost you $1,000, and if you did, here you have spent a percentage of what you are worth.

When I first started betting, I put $100 into a bookmaker and bet $10 a time. As I realised my edge was significant, and my bank kept increasing, I increased by bet size. Imagine me now betting $10 a bet. What would be the point? Some might say that of course you change your bet amount at the end of the season or after each month, but isn’t that just adjusting your bet size to your bank? Why not do it after every bet?

The truth is, to accurately compare the Kelly Criterion to flat betting one has to keep constant the percentage of the bank that one bets. With PG’s card game example, the average bet size using the Kelly criteria based on odds of 1.95 is 14.47%.  So lets do the simulation example, comparing how the Kelly Criterion went compared to flat betting with each bet at $1,447 (14.47% * $10,000).

Whilst the average Kelly bet bank $49,320.70 over the 50,000 simulations, the average bet size when flat betting was only $29,623.16. That’s a $39,000 profit compared to $19,000 profit – Less than half the profit. In fact Kelly betting had a greater profit 32% of the time.

But what happens if we compare with say, 1000 bets like previously? Kelly betting finished, as previously, with an average bank size of just over $100 Billion, whilst flat betting finished with an average bank size of $205,966.82. That’s 500,000 times smaller. Ouch!

In fact flat betting only had a higher bank than Kelly betting 0.6% of the time.

PG finally digs himself a hole by stating that it is “futile” to try to estimate the probability of a team winning because there are so many “countless variables involved” and hence  “you can never know what your winning expectation might be”

Quite clearly, PG is from the old school of professional gambling. One who hasn’t woken up to the power of mathematics. I wish J. R. Miller all the best of luck of course, but in the mean time, consider his article on debunking the Kelly System, debunked.

Posted in Blog, Gambling Blog | 11 Comments

2012 NRL season set to start

The NRL season is set to start this Thursday, and once again Sportpunter will be providing predictions every Thursday afternoon. What’s more, all the predictions will be free of charge for the entire year, so there is no reason why you shouldn’t be following them.

Over the years we have made a very handy 5% return on every bet, however the last few years, the results have been disappointing. Perhaps there is a reason for this, and the analysis we look into below will sort this out.

Shown below is our betting analysis for the past 2 years. Note the large amounts of bets on outsiders with odds above 2.00. Previously, this had been a gold mine with NRL betting, with so many outsiders getting up. But it seems that the tables have turned and the value on betting on the outsiders might not have the same value. Perhaps our long term Sportpunter clients have jumped on board and swayed the results. This could well be, because we have mentioned time and time again as shown here and here, about the value on the underdogs in the NRL.

However it seems as given from below, that the bias might not be there anymore. We have adjusted our models to account for this.

Odds

#Bets

#Wins

%Wins

 $Bet

 $Profit

%ROI

1

1.5

4

4

100%

 $        697.52

 $     330.63

47%

1.5

1.75

21

14

67%

 $    3,496.63

 $     160.72

5%

1.75

2

24

13

54%

 $    3,913.55

 $        66.89

2%

2

2.5

63

22

35%

 $    8,477.45

-$ 2,298.89

-27%

2.5

3

79

28

35%

 $  10,448.70

-$ 1,627.41

-16%

3

4

54

15

28%

 $    7,090.34

-$ 1,733.39

-24%

4

20

26

7

27%

 $    4,050.16

 $  1,198.64

30%

271

103

38%

 $  38,174.35

-$ 3,902.81

-10%


As for when to bet, a lot of people ask if one should bet straight away at the start of the season or wait a few weeks to see how it goes. Similar to our analysis in Super 15s rugby union, we tested how the model did on every round of the year and the results are found below. With four of the first five weeks showing profits, there seems to be no logical reason to hold off betting the early rounds of the NRL.

So there we have it. Make sure you check out the free NRL predictions on the webpage, and also make sure you check out the AFL predictions as well. With NAB predictions happening now for the AFL, it’s also a great time to subscribe for season 2012. Click here for details.


Round

 $Bet

$Profit

%ROI

1

 $      7,099.57

2256.6

31.8%

2

 $      7,127.92

581.22

8.2%

3

 $      6,195.45

-350.04

-5.6%

4

 $      6,736.86

1831.12

27.2%

5

 $      6,095.08

1330.54

21.8%

6

 $      5,635.55

-1906.05

-33.8%

7

 $      5,871.47

-1787.25

-30.4%

8

 $      5,499.42

347.19

6.3%

9

 $      3,263.03

516.43

15.8%

10

 $      4,849.34

-570.02

-11.8%

11

 $      5,134.69

-949.16

-18.5%

12

 $      4,890.31

1106.5

22.6%

13

 $      6,071.49

2264.44

37.3%

14

 $      7,050.91

-1221.14

-17.3%

15

 $      5,747.75

-826.49

-14.4%

16

 $      6,589.32

3193.97

48.5%

17

 $      6,289.23

-156.24

-2.5%

18

 $      6,216.37

5058.63

81.4%

19

 $      5,879.54

-1216.19

-20.7%

20

 $      6,127.15

-1402.22

-22.9%

21

 $      7,108.51

2120.51

29.8%

22

 $      6,995.72

1336.26

19.1%

23

 $      6,925.25

693.86

10.0%

24

 $      8,157.11

-2505.2

-30.7%

25

 $      8,590.07

-452.92

-5.3%

26

 $      7,029.71

-1903.82

-27.1%

27

 $      3,240.70

314.17

9.7%

28

 $      1,693.92

567.33

33.5%

29

 $          808.34

260.31

32.2%

30

 $          340.93

-17.93

-5.3%

 $  169,260.71

 $  8,514.41

5.0%


Posted in Model, Sport Models | Leave a comment

Super 15s kick off

The 2012 season of Super 15s rugby starts today, and predictions are free on the website. This year is our tenth year of predictions on the Sportpunter website, and with over 500 bets in that time we have made a very impressive 7% ROI. Last year alone we made 86 bets with a profit of 11.4% ROI, so hopefully the good profits will continue.

I’ve also done a bit of analysis about how the model has gone for certain rounds of the year.  The analysis is shown below with results added up since 2004. Clearly it shows that the first few rounds of betting are very profitable. Rounds 5 to 9 showed a loss, followed by mid year profits again.

Personally, I wouldn’t read a lot into below. The fact that rounds 5 to 9 is not profitable is most likely due to random variation as the number of bets is not huge. The same could also be said of the first 4 rounds, however there is enough evidence I believe to say that the model has just as much chance to be profitable in the early rounds as any other round. No need to wait a few weeks to see how the model goes.

Predictions will be up on the website every Friday at Noon Australian Eastern standard time, so make sure that you take a spoil of the winnings!

Click here for all the free predictions

Round

$Bet

$Profit

%ROI

1

$7,839.10

 $     333.43

4%

2

$6,684.79

 $        57.25

1%

3

$6,203.77

 $  1,356.86

22%

4

$7,151.97

 $  2,279.63

32%

5

$5,402.55

-$     952.32

-18%

6

$5,781.51

-$     439.99

-8%

7

$6,062.96

-$     467.95

-8%

8

$6,544.03

-$     323.71

-5%

9

$5,160.99

-$ 1,182.74

-23%

10

$3,758.33

 $     522.08

14%

11

$4,972.25

 $  2,833.07

57%

12

$4,724.81

 $     880.80

19%

13

$3,068.83

 $  2,646.32

86%

14

$2,116.83

-$     211.37

-10%

15

$1,683.91

 $     135.64

8%

16

$1,067.64

-$     868.90

-81%

17

$932.27

-$     149.49

-16%

18

$1,290.19

 $     127.90

10%

19

$250.94

-$     250.94

-100%

20

$413.86

-$     287.35

-69%


Posted in Model, Sport Models | Leave a comment

AFL NAB Cup multis

Betfair have a new multi betting option available here: http://ausmultis.betfair.com/

But there are some opportunities involved for the NAB Cup. Very rarely do sports teams play two matches on the one day, and one can assume that there should be some form of dependence on the two events. In other words, if a particular team were to win the first of their two matches, then they are probably more likely to win the second.

This indeed occurred last year, where in the 6 groups, 4 teams won both their matches, where as two teams (Essendon and st. Kilda) would have paid out at half ticket price due to their draw.

But according to the multi’s at betfair, you can multi these up and multiply the odds together. More surprisingly, is that you can multi a win for a particular match with a team winning the NAB cup.

That surely is not independent.

Whilst, one has to make up for the overround of the bookmakers, there might be some value here using this method. Something to keep in mind.


Sportpunter’s AFL model subscription is available now. Click here for details

Related Posts with Thumbnails
Posted in Blog, Gambling Blog | Leave a comment