Selling on DailyProfit

It’s been a while since we’ve updated this page. In case you hadn’t realised, I have stopped selling my tips on Sportpunter after many many years of doing so.

But that doesn’t mean that you still can’t get hold of them. I been selling them of late through dailyprofit’s website. So you can get the same great tips for AFL, NRL, NBA and more through dailyprofit

Head over to their website to find out more.

Posted in Blog, Gambling Blog, Model, News | Leave a comment

AFL 2018 season set to start

AFL Season 2018 is about to start this Thursday and once again Sportpunter will be providing their predictions for every game.

The sportpunter AFL model has been one of our golden models. Season 2018 will be the 20th year that we have made predictions for AFL, and over that time we have suggests 2595 bets at a rate of 9.6% POT betting head to head, and have suggested 1859 bets at 10.3% POT betting the handicap.

We’ve also shown previously that the early rounds are the rounds that are most profitable, so make sure that you are fully signed before the season starts. Please note that any signups on the Thursday will most likely miss the first round, so make sure you have signed up by this Wednesday.

Best of punting luck, and here’s to hopefully another successful AFL betting season.

You can subscribe or view the packages on this link: http://www.sportpunter.com/sports/afl/

Posted in Model, Sport Models | Leave a comment

NRL Season 2018 Analysis

The NRL season is fast approaching us, and Sportpunter are once again releasing their player based model . Since 2014, we have had excellent results based on the player based model , with head to head bets making 7.5% POT from 576 bets, whilst line betting making 7.0% POT from 626 bets.

We’ve also decided to analyse betting results based on odds as how it goes either side of the state of origin.

Shown below is how the model has gone since 2014 for different odds for head to head betting. As you can see, when the odds are less than 1.6, the model has actually made a 3.2% POT loss. However, with only 161 bets, this is a small sample size. Perhaps there is something in it? I’ll leave that to the individual. Either way, a 15.4% POT betting on underdogs has been since 2014 with 315 bets, which is very handy indeed.

Interestingly, the h2h model seems to work better betting on favourites the week before and after origin. Betting favourites either side of origin has needed 17.6% POT from 45 bets, whilst betting on underdogs has lost 21% POT from 51 bets. This could be substantial, and something to look out for in the future, despite the small sample size.

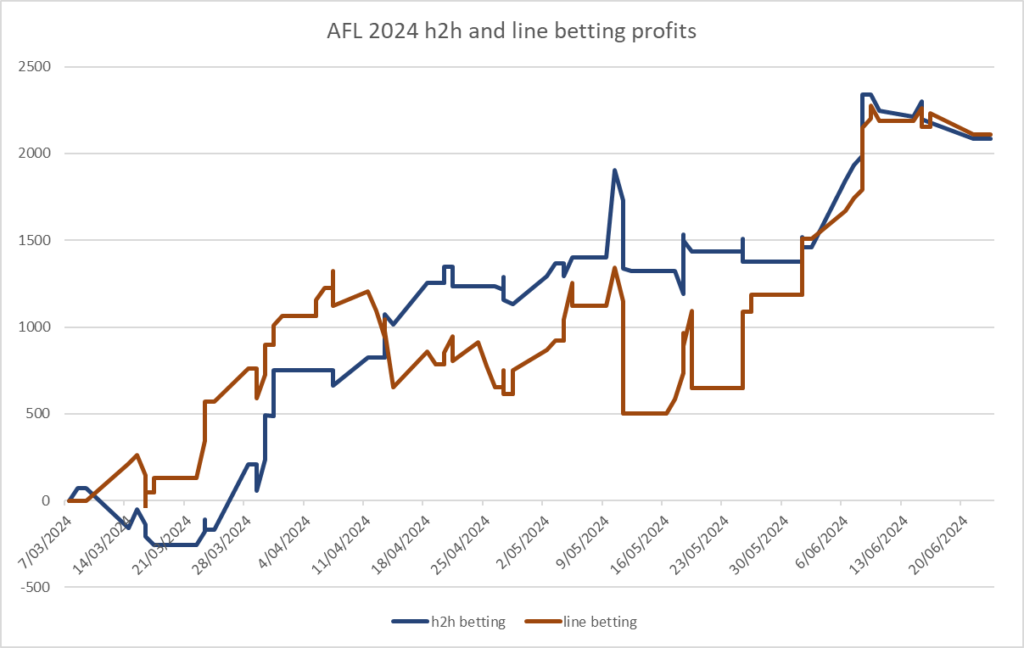
When analysing round by round, it’s clear that head to head betting has been extremely profitable in the opening half of the season. After about round 15, profits decrease. But the first half of the season sees a 14.8% POT from 302 bets since 2014.

Odds#Bets$Bet$Profit%ROI
11.337 $17,093.38 $1,992.39 12%
1.31.447 $17,245.73 $161.851%
1.41.677 $24,205.61 -$4,027.20 -17%
1.62100 $26,426.66 $3,612.85 14%
22.5128 $28,583.50 $125.160%
2.5389 $17,339.12 $6,801.64 39%
35098 $12,769.15 $2,134.58 17%
576 $143,663.15 $10,801.28 7.5%
Week b4 Origin
Odds#Bets$Bet$Profit%ROI
127 $2,129.15 $310.9015%
25528 $5,624.91 -$921.55-16%
35 $7,754.06 -$610.65-7.9%
Week after Origin
Odds#Bets$Bet$Profit%ROI
1238 $13,122.29 $2,379.71 18%
25523 $4,064.65 -$1,183.15 -29%
61 $17,186.94 $1,196.56 7.0%
Round#Bets$Bet$Profit%ROI
1346 $10,917.87 $1,057.45 10%
3662 $16,032.56 $4,963.67 31%
6975 $16,522.33 $320.592%
91265 $16,059.46 $1,577.58 10%
121554 $13,810.52 $2,971.91 22%
151855 $15,847.10 -$216.72-1%
182156 $13,530.41 $945.947%
212465 $17,113.43 -$954.24-6%
242772 $18,343.25 $7.440%
273326 $5,486.24 $127.672%

With regards to line betting, it seems that line betting has been profitable across the board, whether betting on short prices favourites (negative lines) or underdogs (positive lines). A very similar profit to head to head recorded.

Either side of origin, line betting hasn’t been profitable, although it has made small gains betting on favourites the week after origin. Once again, only a sample size of just over 100, but a 3.8% POT loss had been made, which is something that one might be conscious about.

With regards to line betting, the model seems to very consistent throughout the season, and might be the preferred method of betting in the second half of the season.

Odds#Bets$Bet$Profit%ROI
-55-9126 $39,523.82 $1,906.51 5%
-9-590 $21,008.40 -$920.37-4%
-5-350 $12,480.13 $1,603.47 13%
-3063 $14,389.97 $498.893%
0241 $10,795.13 $670.716%
2356 $10,758.09 $1,826.11 17%
3421 $5,157.34 -$419.22-8%
455179 $41,539.57 $5,707.34 14%
626 $155,652.45 $10,873.43 7.0%
Week b4 Origin
Odds#Bets$Bet$Profit%ROI
-55014 $3,250.98 -$8.610%
05526 $6,256.88 -$795.82-13%
40 $9,507.86 -$804.42-8.5%
Week after Origin
Odds#Bets$Bet$Profit%ROI
-55045 $12,490.25 $608.455%
05522 $5,108.57 -$845.78-17%
67 $17,598.81 -$237.34-1.3%
Round
Odds#Bets$Bet$Profit%ROI
1348 $11,264.15 $984.939%
3669 $17,174.04 $367.622%
6975 $16,786.11 $1,185.09 7%
91267 $16,496.83 $3,118.66 19%
121558 $14,375.09 $3,718.17 26%
151864 $16,532.68 -$3,382.62 -20%
182160 $15,751.25 $1,158.03 7%
212477 $20,245.77 $631.343%
242782 $21,379.18 $1,476.01 7%
273326 $5,647.35 $1,616.20 29%

Please note that past events are not a recipe for future ones, but the analysis shown could be very important to maximising your profit throughout the 2018 NRL season.

Either way, analysis has shown that betting the NRL year after year has been very profitable indeed and hopefully 2018 will continue in that form.

Make sure that you don’t miss out on the first round of the NRL season. Details of subscription packages are shown on this link.

Posted in Model, Sport Models | Leave a comment

Sportpunter NBA. Odds Analysis Part 4

This is the final of the four part model analysis of our NBA model. To view the other articles first, then follow these links for articles one, two and three.
Many will know that when I release probabilities for NBA I release them at two different times. The first is around 6pm and the later around 9am. This is because at 6pm Australian time, bookmakers have prices up some, but usually not all the matches. Perhaps they are waiting on team injury news, but at the time of uploading, not all the odds are available for all the matches. When I update the probs at around 9am, I add the current odds to all the matches that did not have bets.

So which update has done better? The answers below.

Unfortunately I only starting recording at what time the updates occurred about 2 months into last season. So the following analysis only includes season 2016/17 and doesn’t include the first 2 months which have traditionally been very positive. However the intention of this article is not to measure how profitable the model is but rather compare early release of odds to late release of odds.

In all the tables shown below, OddsType1 is the early release of odds (around 6pm) and oddstype2 is the later release of odds. The first table shown below is for head to head betting.

OddsType1
MinSeasonMatch#Bets$Bet$Profit%ROI%ProfitFinPin$DiffProfit
1100$-$-#DIV/0!$-$-
10201$213.19-$213.19-100.0%-$213.19$-
203049 $8,640.02 -$1,625.07 -18.8%-$1,595.84 -$29.23
304052 $9,524.31 -$118.13-1.2%-$1,086.36 $968.23
405036 $4,421.24 $45.861.0%$245.85-$199.99
506043 $6,193.33 $333.935.4%$25.15$308.78
607058 $9,303.00 -$631.34-6.8%-$534.46-$96.88
708045 $7,453.13 $1,558.78 20.9% $1,424.19 $134.59
809028 $3,764.71 -$350.78-9.3%-$310.69-$40.09
9017047 $8,990.51 -$3,923.74 -43.6%-$3,361.48 -$562.26
359 $58,503.45 -$4,923.67 -$5,406.82 $483.15
OddsType2
MinSeasonMatch#Bets$Bet$Profit%ROI%ProfitFinPin$DiffProfit
1100$-$-#DIV/0!$-$-
10200$-$-#DIV/0!$-$-
203044 $8,248.97 $2,640.35 32.0% $2,310.67 $329.68
304042 $6,351.99 -$1,775.63 -28.0%-$1,791.23 $15.60
405040 $6,786.03 -$1,462.13 -21.5%-$1,189.65 -$272.48
506048 $8,295.20 $4,511.19 54.4% $4,328.90 $182.29
607025 $2,860.53 $1,474.42 51.5% $1,298.07 $176.36
708045 $7,064.96 -$987.43-14.0%-$1,085.79 $98.36
809055 $9,454.99 $3,517.63 37.2% $3,157.29 $360.34
901700$-$-#DIV/0!$-$-
299 $49,062.65 $7,918.41 $7,028.26 $890.15

The table above shows that the later release of predictions was in fact more profitable than the early release of predictions. A profit of nearly $8,000 for the later, compared to a loss of nearly $5000 for the earlier. Note however that the $DiffProfit amount for each ($483 and $890) is compareable, indicating that the odds still move in our favour after release and probably equally as much. With such a small sample size there is not a lot that we can say about that apart from perhaps that perhaps the later release time might be slightly more profitable as more knowledge of injuries etc. are known.
Similar results are shown for line betting but highlighted even more.

OddsType1
MinSeasonMatch#Bets$Bet$Profit%ROIAv. Line Change%ProfitFinPin$DiffProfit
1100$-$-#DIV/0!#DIV/0!$-$-
10201$176.19-$176.19-100.0%1.00-$176.19$-
203053 $8,377.48 -$1,124.31 -13.4%0.09-$1,700.89 $576.58
304054 $9,665.74 $80.530.8%0.07$404.77-$324.25
405038 $5,075.08 $286.385.6%0.03$487.62-$201.24
506047 $6,884.42 -$354.89-5.2%-0.06-$197.33-$157.56
607059 $9,424.57 -$418.37-4.4%0.20-$605.44$187.07
708047 $7,911.13 $579.787.3%-0.04 $1,061.80 -$482.02
809025 $4,696.49 $333.287.1%-0.20$559.33-$226.05
9017050 $12,247.13 -$3,019.26 -24.7%-0.01-$3,504.12 $484.86
374 $64,458.23 -$3,813.07 -$3,670.46 -$142.61
OddsType2
MinSeasonMatch#Bets$Bet$Profit%ROIAv. Line Change%ProfitFinPin$DiffProfit
1100$-$-#DIV/0!#DIV/0!$-$-
10201$375.92-$375.92-100.0%0.00-$375.92$-
203044 $10,211.91 $1,520.91 14.9%0.25 $1,235.64 $285.26
304047 $7,710.88 -$1,798.07 -23.3%0.36-$1,420.88 -$377.19
405048 $8,794.44 $1,109.20 12.6%-0.07$91.84 $1,017.35
506043 $9,470.82 $1,399.69 14.8%0.16$65.51 $1,334.19
607031 $5,043.62 $826.0916.4%0.55$293.58$532.51
708049 $10,277.24 -$504.56-4.9%0.27-$453.44-$51.12
809059 $14,493.42 -$141.52-1.0%0.04-$676.98$535.46
901700$-$-#DIV/0!#DIV/0!$-$-
322 $66,378.24 $2,035.82 -$1,240.64 $3,276.46

Profits were positive for OddsType 2 (later release) and negative early, but the $DiffProfit is substantially different, which odds moving in our favour greater for the later release.

Once again it’s the totals betting that has everyone talking the most.

OddsType1
MinSeasonMatch#Bets$Bet$Profit%ROIAv.%Change%ProfitFinPin$DiffProfit
1100$-$-#DIV/0!#DIV/0!$-$-
10202$316.51$303.0495.7%1.50-$85.18$388.22
203052 $9,695.77 -$37.49-0.4%0.99-$85.41$47.92
304057 $10,616.44 $1,435.90 13.5%0.35$954.15$481.75
405053 $8,201.58 $563.016.9%0.13$204.22$358.79
506051 $7,665.38 $642.678.4%0.54$542.70$99.96
607049 $8,329.69 $3,751.39 45.0%0.43 $3,845.38 -$93.98
708042 $6,306.73 $1,929.14 30.6%0.82 $1,495.04 $434.10
809023 $3,334.11 $1,369.05 41.1%0.72$562.03$807.02
9017044 $8,143.26 $1,409.87 17.3%0.22 $1,135.64 $274.23
373 $62,609.48 $11,366.58 18.2% $8,568.57 $2,798.01
OddsType2
MinSeasonMatch#Bets$Bet$Profit%ROIAv.%Change%ProfitFinPin$DiffProfit
1100$-$-#DIV/0!#DIV/0!$-$-
10201$109.17-$109.17-100.0%-2.00-$109.17$-
203037 $8,394.96 $1,359.72 16.2%0.89$177.95 $1,181.77
304046 $9,903.73 -$848.35-8.6%0.35-$682.68-$165.66
405040 $6,429.61 -$864.01-13.4%0.64-$882.53$18.52
506046 $7,138.43 -$711.60-10.0%0.77-$1,096.85 $385.25
607033 $6,084.02 -$207.45-3.4%0.33$539.36-$746.81
708038 $5,379.41 $27.580.5%0.07-$213.89$241.47
809046 $8,680.26 -$1,400.10 -16.1%0.10-$1,411.84 $11.74
901700$-$-#DIV/0!#DIV/0!$-$-
287 $52,119.59 -$2,753.39 -5.3%-$3,679.66 $926.27

A 18.2% ROI profit was made last year (not including the first two months), from 373 bets betting with the early 6pm markets. A high $DiffProfit also indicates that on average the odds moved in our favour quite substantially even during playoffs. A loss was made on OddsType2, but this could easily be attributed to random variation considering the positive $DiffProfit amount.

I know it’s hard to get your head around, but in summary we can say this. The Sportpunter NBA model is very strong. Its profits have been consistent throughout the years and I see no reason why they wouldn’t continue to be in the future. Totals betting seems to yield higher returns and is profitable all season, whilst head to head and line betting models are better exploited early and then treated with caution late in the season.

One thing is for sure, is that profits start from the first match of the season, so it’s very important to jump on board and don’t miss the early profits in season 2017/18.

To sign up to the Sportpunter 2017/18 NBA model, click here for details. http://www.sportpunter.com/sports/basketball/nba/

Posted in Model, Sport Models | Leave a comment

Sportpunter NBA. Odds Analysis Part 3

Previously we looked at how our Sportpunter NBA model has gone betting throughout the season (http://www.sportpunter.com/2017/10/sportpunter-nba-odds-analysis-part-1/) as well as how it had gone when compared to finishing prices (http://www.sportpunter.com/2017/10/sportpunter-nba-odds-analysis-part-2/). But today we will look at the expected profits based on those finishing prices and how we would have gone betting throughout the season.

The Tables shown below will look very similar to the tables on the first article with two columns added. The first table is based on head to head betting, and the two extra columns are %ProfitFinPin and $DiffProfit. What this indicates is that if we bet the same amount as we did when we suggested the bet, but not at the suggested bet price, but rather the finishing Pinnacle price then how would we have gone. The last column, $DiffProfit looks at the difference between the actual profit, and the profit based on finishing Pinnacle Prices.

Sound complex? Maybe, But what this means is that if $DiffProfit is positive, then our profits are greater than what we would expected, in other words, they are good bets. If $DiffProfit is negative, then perhaps the profits are not great as on average the odds have moved against us. A positive $DiffProfit means that the odds have moved in our favour when compared to finishing price, and if it is negative the odds have moved against us.

MinSeasonMatch#Bets$Bet$Profit%ROI%ProfitFinPin$DiffProfit
110139 $32,492.94 $9,965.88 30.7% $10,364.19 -$398.31
1020535 $100,861.12 -$1,220.90 -1.2%-$1,144.30 -$76.59
2030484 $83,727.42 $5,968.13 7.1% $3,877.33 $2,090.80
3040455 $70,763.48 -$4,567.31 -6.5%-$5,620.51 $1,053.20
4050446 $67,946.01 -$2,323.13 -3.4%-$2,234.44 -$88.70
5060465 $69,879.15 $6,693.77 9.6% $5,951.19 $742.58
6070439 $62,298.43 $7,574.05 12.2% $7,209.49 $364.56
7080439 $59,678.20 -$968.59-1.6%-$1,507.79 $539.20
8090466 $80,206.26 $2,826.39 3.5% $1,336.25 $1,490.14
90170269 $42,808.97 -$10,232.47 -23.9%-$9,720.84 -$511.62

The table above looks at head to head betting and the minimum number of matches for each team. The $DiffProfit column indicates a small negative amount early, followed by large positive amounts and then a negative amount ($-511) at the end of the season. Firstly the sum of the $DiffProfit amount is positive, which is great and indicates a good healthy and profitable model . It is slightly negative at the start which could indicate that perhaps we have been slightly lucky early on in the season or that we are pushing a position with the model which is not favoured that much around smart money. Considering the amount of profit that has been made in the first months, I believe this is purely due to random variation and a little bit of luck in our favour.

The model is strong throughout the year but negative when it comes to playoffs, once again indicating that stopping betting at playoffs is preferred for head to head betting.

For line betting as shown by the table below it is a little different

MinSeasonMatch#Bets$Bet$Profit%ROIAv. Line Change%ProfitFinPin$DiffProfit
110159 $38,455.33 $5,170.87 13.4%0.142 $4,508.60 $662.26
1020575 $123,332.86 $6,260.14 5.1%0.127 $4,586.45 $1,673.69
2030505 $95,984.23 $6,319.83 6.6%0.095 $5,301.23 $1,018.60
3040489 $85,209.79 -$1,133.59 -1.3%0.082-$786.81-$346.77
4050496 $86,026.81 -$2,239.35 -2.6%0.052-$3,389.21 $1,149.85
5060471 $88,711.70 $3,716.12 4.2%0.128 $5,120.80 -$1,404.68
6070461 $77,347.09 $1,032.35 1.3%0.072-$1,201.93 $2,234.28
7080453 $81,855.98 $254.560.3%-0.029$260.88-$6.31
8090469 $104,366.07 -$4,165.02 -4.0%0.057-$3,290.51 -$874.52
90170264 $51,980.24 -$8,749.92 -16.8%-0.031-$8,390.16 -$359.76

We have relatively positive amounts in the $DiffProfit column up to around minimum match 70. When the minimum match of each team is 70-80 then expected profits is basically zero, as was the actual profits. Once again this confirms that betting the line up to around a month out of playoffs might be the best way to go.
For totals betting as shown below, totals profits as shown in $DiffProfit are strongly positive throughout

MinSeasonMatch#Bets$Bet$Profit%ROIAv.%Change%ProfitFinPin$DiffProfit
110148 $36,282.58 $5,195.24 14.3%0.370 $3,989.31 $1,205.93
1020561 $120,678.39 $4,220.35 3.5%0.445-$1,041.29 $5,261.64
2030466 $84,370.44 $2,852.37 3.4%0.643-$617.48 $3,469.85
3040462 $78,393.49 $4,409.70 5.6%0.430$568.47 $3,841.23
4050440 $67,681.26 -$5,266.76 -7.8%0.314-$9,201.31 $3,934.55
5060442 $69,122.96 -$2,124.86 -3.1%0.437-$6,021.21 $3,896.35
6070471 $77,317.46 $1,255.55 1.6%0.340 $1,230.25 $25.30
7080417 $64,610.29 $3,659.75 5.7%0.418 $1,392.24 $2,267.51
8090394 $63,503.74 $2,995.83 4.7%0.385-$590.35 $3,586.18
90170262 $49,956.23 $4,960.97 9.9%0.198 $4,938.81 $22.16

Note that for playoffs, the variable $DiffProfit is only slightly positive, indicating that at this stage the lines are not moving that much in our favour despite our bets and staying pretty constant. But it does show that on average throughout the season, the line on average for totals moves in our favour greatly.

So we have shown not only how profitable the model is, and how when the odds move in our favour is it even more profitable, but we have also shown when the odds move in our favour as well.

In the final of the four part article series, we will look at betting early, compared to betting late.

To sign up to the Sportpunter 2017/18 NBA model, click here for details. http://www.sportpunter.com/sports/basketball/nba/

Posted in Model, Sport Models | Leave a comment

Sportpunter NBA. Odds Analysis Part 2

We previously (http://www.sportpunter.com/2017/10/sportpunter-nba-odds-analysis-part-1/ ) looked at how the Sportpunter NBA model had done as the season progresses, but how much of that is random variation and how much is a true reflection of how powerful the model actually is?

One way to analyse how good the model is is comparing our bets to the Pinnacle finishing line. If our bets are really good, then the finishing line should in theory move in the direction of our suggested bet. In other words, we take on the assumption that as we get closer to the start of the match, the odds become a more accurate representation of what the true odds of each team are to win.

Shown below is a table for head to head betting that shows the %difference of the odds that we suggested a bet at compared to the finishing pinnacle odds for that match. A %change in odds that is greater than 1 indicates that the odds have come in (and we have obtained better odds than the finishing price), and likewise a %difference of the odds that is less than 1 indicates that the odds have ballooned against us.

%ChangeinOdds#Bets$Bet$Profit%ROI
0.40.857$6,972.15$1,452.9420.80%
0.80.8581$9,577.96-$3,176.17-33.20%
0.850.9146$18,837.89-$1,008.66-5.40%
0.90.95370$51,342.94-$9,470.91-18.40%
0.9511149$195,189.22-$5,296.44-2.70%
11.00001507$85,683.24-$4,470.54-5.20%
1.000011.051153$205,900.70$16,866.478.20%
1.051.1365$57,288.03-$4,386.84-7.70%
1.11.15140$18,997.70$13,237.9669.70%
1.151.2587$9,484.45$6,157.2464.90%
1.25565$8,768.67$3,790.0043.20%

What this indicates clearly is that when the odds come in after our bet as compared to the finishing odds, we tend to make substantial profits. In fact on average if the %Difference is greater than 1, we have made 11.9% ROI from 1810 bets. Even greater is when the %difference is 1.1+, then we have made a staggering 62% ROI from 292 bets. An example of when this occurs might be for example if we bet on a team at 1.90, and then at the start of the match the odds for the team are 1.70 (1.90 / 1.70 = 1.117).

Some of these cases could be to players changing due to injury, but the majority of cases would be smart money. In that we got on the team before smart money moved the prices. The same goes for the opposite end of the stick. If the price moves against our favour then on average we lose 6.2% ROI from 1803 bets.
There are a couple of things to note here, the profits when the odds move in our favour significantly are a lot higher than the losses if the move against us and also that the above also table includes post season analysis which was previously shown to produce poor results.

We can do the same analysis with line betting as shown below. However this time, instead of looking at the %change in odds, we look as the change in the finishing line.

%ChangeinOdds#Bets$Bet$Profit%ROI
-10.5-286 $16,365.84 -$5,537.15 -33.8%
-2-1.566 $12,935.57 -$1,079.81 -8.3%
-1.5-1115 $22,458.46 $2,059.03 9.2%
-1-0.5299 $57,672.92 -$1,617.50 -2.8%
-0.50733 $136,509.23 -$12,656.25 -9.3%
00.00011443 $274,056.74 $6,119.18 2.2%
0.00011872 $170,125.05 $4,210.98 2.5%
11.5390 $74,954.80 $3,206.00 4.3%
1.52130 $27,107.56 $3,807.31 14.0%
23124 $23,446.67 $4,386.81 18.7%
310.572 $15,272.96 $4,463.78 29.2%

This shows a very similar pattern to that of head to head betting as you would expect.
Totals betting provides the best results as shown on the table below

%ChangeinOdds#Bets$Bet$Profit%ROI
-6.5-2203 $33,146.51 -$3,109.12 -9.4%
-2-1.5156 $25,313.90 -$3,315.60 -13.1%
-1.5-1205 $32,531.62 -$4,915.55 -15.1%
-1-0.5296 $48,538.01 $1,275.61 2.6%
-0.50471 $79,803.42 -$5,215.88 -6.5%
00.0001676 $116,633.72 -$1,949.89 -1.7%
0.00011538 $93,172.28 $570.560.6%
11.5419 $77,582.56 $3,037.83 3.9%
1.52321 $55,895.25 $4,801.27 8.6%
23392 $69,996.80 $10,819.15 15.5%
311.5373 $77,329.32 $19,941.82 25.8%

What is interesting with this table is that not only when the line moves in our favour to we make a greater profit than when it moves against us. (10.4% ROI when line moves with us, as opposed to -7%ROI when the line moves against us), but we also have a lot more bets when the line moves with us (2043) then when it moves against (1331).

Clearly this shows that whilst h2h betting and line betting are profitable, totals betting is amazingly stronger.
So in conclusion, assuming that the finishing line is a more efficient and accurate measure of the true probability of each team winning, then our model holds up very well, especially with totals betting.
In the next article I will look at how profits
and expected profits based on finishing prices go betting throughout the season.
To sign up to the Sportpunter 2017/18 NBA model, click here for details. http://www.sportpunter.com/sports/basketball/nba/

Posted in Model, Sport Models | Leave a comment

Sportpunter NBA. Odds Analysis Part 1

The NBA season 2017/18 is about to start on the 17/10/17 and once again Sportpunter will be releasing predictions every day for every match. Over the seven years that we have been producing probabilities for we have made substantial profits.

In total for head to head betting we have made 2.7% ROI from 4662 bets. Line or handicap betting has made slightly less at 1.5% ROI from 5416 bets, whilst totals have made 3.1% ROI from 5189 bets.

However these amounts can be increased through analysis by not betting at certain stages of the season and with certain overlays. We have shown previously (for example here or here ) that profits can be maximised at the start of the season. Profits in the past have traditionly been extremely good early in the season and then level out throughout the season before turning bad just before playoffs.

Limiting ones betting to the start and middle of the seasons, history suggests, should increase ones profits substantially from those figures shown above.
We have re-analysed the data to show you how much more one could make by limiting your betting later in the season.
Show below is a table showing the mimumum number of matches in that season that a team has played. So for example, if Team1 plays team2 and team1 has played 15 games, and team2 19 games, then the minimum number of games for this match is 15.

MinSeasonMatch#Bets$Bet$Profit%ROI
110139 $32,492.94 $9,965.88 30.7%
1020535 $100,861.12 -$1,220.90 -1.2%
2030484 $83,727.42 $5,968.13 7.1%
3040455 $70,763.48 -$4,567.31 -6.5%
4050446 $67,946.01 -$2,323.13 -3.4%
5060465 $69,879.15 $6,693.77 9.6%
6070439 $62,298.43 $7,574.05 12.2%
7080439 $59,678.20 -$968.59-1.6%
8090466 $80,206.26 $2,826.39 3.5%
90170269 $42,808.97 -$10,232.47 -23.9%
4137 $670,661.99 $13,715.82 2.0%

The table above shows obviously that betting early on has been very profitable and continually profitable up until the teams play around 90 matches. The data includes pre season matches, and with most teams playing 6-7 pre season matches as well as 82 regular season matches, this indicates that results have not been good post season when the minimum games is greater than 90.

If we don’t include post season matches, then the profit increases to 3.8% ROI from 3868 bets.

Similarly the table below shows a similar result, but profits are not there in the month leading up the the playoffs. This could be due to different motivations for teams. Profits up to around minimum matches 70-80 are most profitable with profits getting up to 3.2% ROI from 3156 bets.

MinSeasonMatch#Bets$Bet$Profit%ROI
110159 $38,455.33 $5,170.87 13.4%
1020575 $123,332.86 $6,260.14 5.1%
2030505 $95,984.23 $6,319.83 6.6%
3040489 $85,209.79 -$1,133.59 -1.3%
4050496 $86,026.81 -$2,239.35 -2.6%
5060471 $88,711.70 $3,716.12 4.2%
6070461 $77,347.09 $1,032.35 1.3%
7080453 $81,855.98 $254.560.3%
8090469 $104,366.07 -$4,165.02 -4.0%
90170264 $51,980.24 -$8,749.92 -16.8%

However profits for totals seem to be consistent throughout the year. Theres a small loss in the middle of the season, but this could be attributed to random variation. Profits have been made during the post season matches.

MinSeasonMatch#Bets$Bet$Profit%ROI
110148 $36,282.58 $5,195.24 14.3%
1020561 $120,678.39 $4,220.35 3.5%
2030466 $84,370.44 $2,852.37 3.4%
3040462 $78,393.49 $4,409.70 5.6%
4050440 $67,681.26 -$5,266.76 -7.8%
5060442 $69,122.96 -$2,124.86 -3.1%
6070471 $77,317.46 $1,255.55 1.6%
7080417 $64,610.29 $3,659.75 5.7%
8090394 $63,503.74 $2,995.83 4.7%
90170262 $49,956.23 $4,960.97 9.9%

One thing is for sure, is that profits are especially good from the word go. That is, as soon as the season starts, the best profits are made. So its important to get on board early.

This is the first article of a four part series. In the next article we will look at how we have gone when compared to the finishing line.
To sign up to the Sportpunter 2017/18 NBA model, click here for details.

Posted in Model, Sport Models | Leave a comment

Sportpunter Models Go Bang

during the 2016 AFL Grand Final match between the Sydney Swans and the Western Bulldogs at Melbourne Cricket Ground on October 1, 2016 in Melbourne, Australia.

What a start to the footy season it has been with Sportpunter’s Footy Models.

Let’s take a look at the first two weeks of the AFL season.

15 bets into the AFL season, its only round 2, but already we have made a staggering 54% profit on turnover betting the line. Massive big winning bets on Richmond over Carlton, Brisbane over the Gold Coast and Essendon over Hawthorn has helped the profits roll in. Unfortunately no longer does the AFL model have a Jonathan approved Hawthorn bias, although it’s no secret that I personally wish they would win a game or two! It’s tough betting against your team and then going to the game to support them! I guess either way, I come out ahead, and you can too by following the Sportpunter AFL model which has been running since 1999. All details and betting histories here: http://www.sportpunter.com/sports/afl/

But better than that has been the NRL model. Five weeks in and we are looking at extraordinary profits. This year to date we have made 23 bets for an amazing 46% profit on turnover. These include big wins on St. George over Cronulla (3.03), South Sydney over Manly (2.13), and Manly over Sydney Roosters (3.43). In fact the NRL model has been so profitable since we introduced the player based model that it has made over 10% profit on turnover from 460 bets.

It’s not too late to sign up with plenty of the season still to come. Details and betting history here: http://www.sportpunter.com/sports/rugby-league/

But if its American sports and high turnover that takes your fancy, then take a look at Sportpunter’s NBA model. Once again the model has not failed to impress. This season we have made as expected over the years. 2.4% profit on turnover betting the h2h from 665 bets, 1.7% POT betting the line are both in line with our long term betting record going back to 2010. Totals this year however have gone amazing, making 7.2% POT from 689 bets, which takes the long term result since 2010 up to 3.1% POT from over 5000 bets. Put simply an average $1000 bet on the NBA totals alone, could have netted you just on $50,000 profit for the year to date.

Details here for the NBA: http://www.sportpunter.com/sports/basketball/nba/

Make sure you have a look at the Sportpunter footy models, and best of punting luck.
Cheers
Jonathan
www.sportpunter.com

Posted in Model, Sport Models | Leave a comment

AFL Season 2017 and random variation

The 2017 AFL Season is fast approaching and once again Sportpunter will be providing predictions.

Last year might have been a sour one, but we will show in the analysis below how we expect to go in 2017.

If you look at the bigger picture, we have made 12.1% ROI from line betting in the last 12 years and 10.3% ROI in the last five years. With only about 140 bets per year there’s bound to be year to year variation in results.

In fact, we’ve even done a simulation of potential profits. Given an average line bet size of $190 (as per average bet size of past 10 years), and a random amount bet from as low as $50 up to $329, and 140 bets per year. We simulated the season based on the fact that we have a 10% ROI and a 5% ROI respectively. The graph below shows both. So even with a 10% ROI, over 140 bets there is still a very good chance that we would have a losing year. The graphs show 50,000 simulations and the %ROI that we received after each one.


That just goes to show that, even with a big edge, random variation still plays its part, and as a successful punter, one has to consider this as part of your own personal betting strategy. A live example of random variation can be seen in the NRL model in the last 3 years where a player based model was implemented. In 2014 we made 10.9% ROI followed by only 0.2% ROI the next year and then 13.1% ROI in 2016. (Subscriptions is open for rugby league here)

Interestingly as well though, the average bet size for line betting has decreased a little over the years. Bet sizes increased considerably in 2011 to 2014, around the time we implemented a player based model, however the last two years the average bet size has been considerably lower. Whilst this is only a smaller sample size of 2 years, it could be noted that there could be a reason behind it.

Bet size, using the Kelly method can only be larger due to smaller odds or larger overlays. Whilst betting on the line the odds are kept moderately consistent, the only way where bet size is
smaller if the overlays are smaller.

This can only happen if the market has become more efficient. Perhaps the bookies are pricing up smarter odds, perhaps the odds have been backed in earlier, perhaps the smaller bet size is just random variation. Either way, it’s something for punters to take note of.

That said, there are still plenty of good signs coming up for the 2017 AFL Model, and I’m looking forward to sharing the profits that the last 18 years have produced.
Betting histories and subscription details for the AFL are available here: http://www.sportpunter.com/sports/afl/

Posted in Model, Sport Models | 7 Comments

NRL Season to begin Thursday

The NRL season is set to star this Thursday and once again Sportpunter are giving out predictions. Every day that there are matches at 11.30am predictions will be uploaded, and hopefully they will be as successful as the past.

For the past three years that we have had a player based model, we have seen a profit on turnover of 8.2%

Subscriptions are now available to purchase, and you can double up with AFL to make things cheaper. Make sure you get on early, as results show especially that early rounds can profit even more.

Details here: http://www.sportpunter.com/sports/rugby-league/


Related Posts with Thumbnails

Posted in Model, Sport Models | Leave a comment