NBA Season analysis 2016/17

9372021-lebron-james-nba-finals-cleveland-cavaliers-golden-state-warriorsThe NBA Season is just about to start and Sportpunter will be giving predictions every day for every match in 2016/17. Please note, that as shown below in our analysis, it is critical that you sign up and get the first few weeks of predictions, because – as we shall show below – they are the most important and most successful for our NBA model. Click here to sign up or view prices for Sportpunter’s NBA model for season 2016/17.
Ok, now onto the nitty gritty. Firstly h2h betting. The betting history shows us that we have made 2.8% ROI from 4000 bets since 2010/11 which is great going. However last year we made an incredible 6.8% ROI, and with some simple analysis as shown below we can increase that amount.
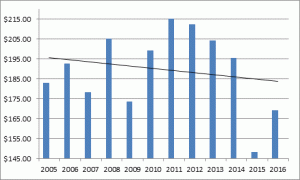
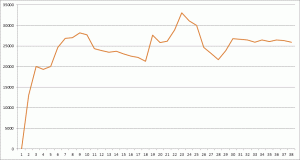
Analysis of profits week by week is shown below in the graph for head to head betting


chart1

Clearly this shows that the majority of the profit has been made in the first 2 weeks. That’s right the first 2 weeks!. But profit also continues to rise until about week 22 to 24. This is generally a week or two just before playoffs. Whilst playoff profits have done well at 2.2% ROI, it’s the week or two beforehand that things don’t do that well. Mostly likely for this is because of teams motivation. Are certain teams not capable of making the playoffs? Maybe some teams have already secured a playoff position, and maybe some teams require every match critical.
I plan on doing more analysis on this, and hopefully by the time we come to 2-3 weeks out from playoffs, I will have upgraded the model to account for this. But if at this stage we don’t include the 2 weeks out from play offs, profits increase from 2.8% ROI up to 3.2% ROI, a slight but nice improvement.

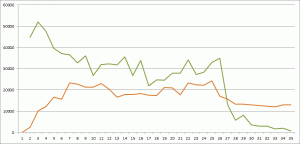
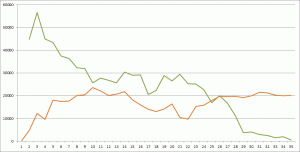
For the line (or handicap betting) for NBA, I have included the profits (shown in brown) along with the amount bet(shown in green).

chart2

On first look, the amount bet clearly decreases as the season progresses, which indicates again that the big overlays occur at the start of the season. The brown line suggests again that most profits are made in the early weeks, and from weeks 10 to 24 have shown near even results. Inn week 25 (one week out from playoffs), a massive 20.7% loss has been made from 127 bets. Clearly, I recommend not betting this week until I can better improve the model. Playoffs have not recorded a profit either. From 227 bets a 10% ROI loss was made. A small sample, but something to be wary about as well. More on this to come with future analysis.

A similar graph has been made with totals betting as well as shown below.

chart3

It also shows (with the green line) that the amount bet decreases as the season progresses. In that the biggest overlays occur at the start of the season. The brown line indicates this as well with profits increasing up till about week 10. Losses were made from then on until round 20, which follows by big profits up to the playoffs. The playoffs record is just over breakeven.
So based on the above, what are my recommendations? Clearly the first few weeks are critical to jumpon board the NBA models, and profits continue to increase until about 2 months in. From then, I will leave it up to you if you continue betting.

However, I highly recommend not betting h2h and line betting a few weeks out from the playoffs.
Make sure you sign up before the season starts. Subscriptions and price information is shown at this link. Best of Sport Punting luck!

Posted in Model, Sport Models | Leave a comment

NFL 2016 analysis

maxresdefaultNFL is back for 2016 and we have included some analysis as shown below.

Shown below are analysis of the NFL betting for the 2014 and 2015 seasons.

Firstly line betting. Results are good at the start of the year, and I see no reason not to be early. However a minimum overlay of 25% might be the best taking. Keep in mind that these are small sample sizes.

For totals betting, profits seem to occur in the latter half of the season from around round 14 onwards. A minimum overlay of 12.5% might be advantageous, and this takes away a lot of the noise, so that betting from around weeks 4 or 5 is best for totals betting.

Once again note that these involve small sample sizes, but hopefully we will come out in front again in 2016/17
You can sign up to the Sportpunter NFL subscription here.

Line Data

Week#Bets#Bet$Profit%ROI
122 $3,874.63 $1,411.99 36.4%
225 $3,419.47 $1,069.81 31.3%
322 $4,021.99 -$517.14-12.9%
420 $4,518.50 -$809.24-17.9%
524 $3,935.43 -$306.78-7.8%
621 $3,863.94 $946.5024.5%
724 $4,692.02 -$722.41-15.4%
818 $4,206.78 $816.0919.4%
921 $4,239.46 $17.820.4%
1019 $2,966.09 -$830.58-28.0%
1122 $4,795.53 $848.0117.7%
1224 $4,988.09 $921.0818.5%
1319 $3,808.18 -$2.13-0.1%
1426 $5,306.91 -$1,087.47 -20.5%
1524 $5,572.21 -$1,505.19 -27.0%
1626 $6,716.63 $420.056.3%
1722 $4,548.67 $1,916.29 42.1%
185$817.81-$55.56-6.8%
196 $1,238.09 $492.7339.8%
201$335.74$278.6683.0%
210$-$-#DIV/0!
Overlay#Bets#Bet$Profit%ROI
0.050.07549 $3,200.60 $715.8722%
0.0750.150 $4,716.13 -$1,576.09 -33%
0.10.12546 $5,540.16 -$214.38-4%
0.1250.1544 $6,459.60 $673.4110%
0.150.17531 $5,450.41 -$848.17-16%
0.1750.222 $4,382.27 $361.518%
0.20.2545 $10,465.60 -$990.55-9%
0.250.343 $12,377.35 $1,491.92 12%
0.30.554 $21,357.45 $3,111.05 15%
0.527 $3,916.60 $577.9615%
Week, Overlay >0.25#Bets#Bet$Profit%ROI
14 $1,405.58 $606.7443.2%
22$658.90$595.5490.4%
33 $1,314.19 -$353.19-26.9%
47 $2,680.90 $133.075.0%
52$887.49-$887.49-100.0%
65 $1,889.03 $604.6832.0%
78 $2,675.08 $60.012.2%
89 $3,025.32 $178.185.9%
95 $1,857.45 $2.570.1%
101$295.99-$295.99-100.0%
118 $2,453.53 $280.1911.4%
128 $2,923.99 $2,149.5873.5%
136 $1,748.01 $718.8641.1%
146 $2,331.61 -$357.29-15.3%
158 $3,252.39 -$932.55-28.7%
1612 $4,632.06 $624.9313.5%
177 $2,644.70 $1,709.7364.6%
180$-$0.00#DIV/0!
192$639.44$64.7010.1%
201$335.74$278.6683.0%
210$-$0.00#DIV/0!

Totals Data

Week#Bets#Bet$Profit%ROI
117 $2,565.06 -$252.10-9.8%
222 $3,724.93 -$187.93-5.0%
322 $3,621.36 -$1,372.34 -37.9%
416 $2,175.13 -$297.87-13.7%
519 $3,163.41 $121.833.9%
618 $3,214.98 -$25.03-0.8%
717 $2,710.22 $1,222.88 45.1%
818 $3,004.15 -$746.86-24.9%
918 $2,562.75 $704.5927.5%
1018 $2,893.62 $404.3914.0%
1120 $3,006.14 -$625.24-20.8%
1219 $2,817.73 -$193.23-6.9%
1318 $2,876.97 $88.753.1%
1422 $4,634.16 $162.873.5%
1521 $3,700.95 $576.2315.6%
1622 $3,820.90 $686.6918.0%
1724 $4,442.35 $225.265.1%
183$350.13-$78.37-22.4%
194$619.82$322.8352.1%
202$203.10-$88.79-43.7%
210$-$-#DIV/0!
Overlay#Bets#Bet$Profit%ROI
0.050.07558 $3,821.70 -$244.55-6%
0.0750.152 $4,842.33 -$40.02-1%
0.10.12542 $4,946.36 -$682.13-14%
0.1250.1538 $5,519.09 $52.471%
0.150.17537 $6,255.54 $751.4912%
0.1750.228 $5,521.11 -$1,672.98 -30%
0.20.2531 $7,184.02 $1,792.54 25%
0.250.324 $6,820.08 -$1,557.78 -23%
0.30.527 $10,063.78 $2,357.56 23%
0.522 $1,079.43 -$53.62-5%
Week, Overlay >0.125#Bets#Bet$Profit%ROI
17 $1,745.34 -$91.61-5.2%
213 $2,901.38 -$225.30-7.8%
311 $2,528.68 -$1,485.25-58.7%
46 $1,414.57 $162.4811.5%
512 $2,593.28 $220.748.5%
612 $2,681.11 $199.157.4%
79 $2,111.08 $1,022.4848.4%
811 $2,323.50 -$700.47-30.1%
98 $1,658.68 $685.4741.3%
109 $1,992.38 $721.8736.2%
1110 $2,199.53 -$346.57-15.8%
129 $1,984.31 -$133.19-6.7%
1310 $2,053.66 $270.8113.2%
1418 $4,264.98 -$51.37-1.2%
1511 $2,737.15 $528.6319.3%
1614 $3,103.89 $526.7617.0%
1714 $3,559.02 $202.625.7%
181$202.85-$202.85-100.0%
192$387.66$365.2894.2%
200$-$0.00#DIV/0!
210$-$0.00#DIV/0!

Posted in Model, Sport Models | 2 Comments

Sportpunter Baseball 2016

watch-baseball-online-streamThe MLB, American Baseball season is fast drawing to a start and this year Sportpunter are going to be doing something a little different.

We will be giving away the predictions for free.

For the first week, predictions will be free of charge, and to get them, you just need to sign up a little form from our main baseball webpage here: http://www.sportpunter.com/sports/baseball/

And as shown by our analysis as linked here, there’s no better time to get on board. This link will show you our analysis of the 2014 and 2015 seasons. Our betting analysis has shown a 7.8% ROI betting on totals from nearly 2000 bets. Almost twice as much has been bet on the unders, for almost twice the return on turnover.

Surprisingly, overlays above 12.5% for betting over the line were not profitable, however it is a smallish sample size. Similarly overlays under 15% were not profitable for betting unders. Profit by month was most interesting, with a staggering 14% ROI made in the first 2 months. 3.8% ROI was made with the remainder of the season, so results were still very promising later.

So obviously it is very important to get on board the baseball totals model early in the season, and now that it’s free. It should be a no brainer! Predictions, at this stage will be released between 9pm and 10pm AEST.

Click here for all the info: http://www.sportpunter.com/sports/baseball/

Posted in Blog, Gambling Blog | Leave a comment

AFL Season 2016

hodgeHi Guys, just a quick note to remind you that the AFL season starts on Thursday.

Over the years we have had an amazing record as shown here. The last 7 seasons has seen us record over 15% profit on turnover betting the line.

Incredible stuff. Last year we recorded a 6.3% POT, but astute punters will remember that I did not recommend any of the suggested bets in round 23 (one round before finals), due to motivational factors of teams (teams resting entire teams, dead rubbers etc. etc.).

If you were to follow that advice, then the profit on turnover increases to 11.4% for the year.

AFL betting has been Sportpunter’s bread and butter, and our previous articles have suggested that a lot of the profits come in the early rounds as shown here: http://www.sportpunter.com/2014/03/afl-profits-round-by-round/

So make sure you sign up for 2016, as places could well be limited.
Click here for all the information and statistics: http://www.sportpunter.com/sports/afl/

Posted in Model, Sport Models | Leave a comment

NRL 2016 Season analysis

9885ec3187ff9cd0ee98ae23cd040c35The rugby league NRL season 2016 starts tonight with the Eels taking on the Broncos, and once again Sportpunter will be delivering predictions for the upcoming season.

We are excited again with our model, as it has shown over the past two years to be very profitable since we introduced our player rating system. In fact the last 2 years we have made 5.4% ROI from 291 bets, and we hope that that number will continue into 2016.

Subscriptions are available with prices as shown here, and the betting histories are shown here:

But first, let’s do some analysis on how the model has gone, specifically looking at the last two year. Please refer to this webpage, with links to the right outlining the statistical analysis for all figures.

Analysis shows that we have made a 5.4% ROI from 291 bets as previously stated since the player based model started. But interestingly, most of those profits occurred with the Away side. 11% ROI was made from 179 betting on the away team, as opposed to a 2% loss for the home team.

When looking at the probability, a small loss was made betting on teams with probs < 50%, whilst a 6.5% ROI profit was made on our calculated favourites. When looking at analysis by odds, we see an interesting picture. All up a 7.2% loss was made betting on teams with odds less than 1.90, whilst an incredible 21% ROI was made betting on the underdogs. Analysis by overlay showed an increasing profit with increasing overlay which is a great sign of an accurate model.

Analysis by round showed that early stages are very good betting opportunities, with an 11.8% ROI made in the first 20 rounds, whilst the last 10 rounds provided an 8.6% loss. Please note however, that these involve very small sample sizes and not too much should be written into it. However it is interesting analysis and one might want to change their strategies based on this information.

Probably the greatest analysis from above is how the away team and underdogs seem to have gone with the model in the past two seasons. Does the model just pick a good dog, or is it biased to the away team? Well one way to work this out is to test how the model has gone blind betting every game to win $1000.

As shown in the link above, blind betting the home team over the last 2 years has resulted in a 5.8% loss as compared to only a 2.8% loss blind betting the away team. A small difference, but more interestly, blind betting the favourite resulted in a 7.8% loss whilst blind betting the underdog results in a 7.4% profit. One could have easily just bet every dog the last two years and been way on top.

Blind betting the Underdog when away was even better, resulting in a 9.7% advantage.

So is this a long term trend, or just a recent adjustment, or do we not have enough data to come to any concrete conclusions?

Well I decided to look back on all data (that I have) since 2005. Analysis shows here that blind betting the home team resulted in a 2.8% loss, whilst the away team had a 6.7% loss. Blind betting the fav had a 5% loss, whilst blind betting the underdog only a 1% loss. Blind betting the underdog if playing away had a 3.8% loss.
The difference between the losses made blind betting the favourite and the underdog is significant, and it tells me that the underdogs are underrated, maybe moreso recently. Has home ground advantage diminished over the years? Possibly, and teams become more professional in their strategies.

So what should we conclude about the model and best form of attack in 2016? Well in total, we should hopefully be able to produce another great profit, and you must note that in the last two years more bets are suggested on the underdog than the favourite. So any bias in the odds is already accounted for with the model. Will the underdog bias continue? Most likely, but just betting the underdog could be a recipe for disaster as the market adjusts.

To subscribe to Sportpunter’s model in 2016 the click here for all the information.

Posted in Model, Sport Models | Leave a comment

Super Rugby 2016

Super-Rugby-2015-Preview-610x360The Super Rugby season starts again this weekend, and Sportpunter once again will be giving predictions for it.

Over the years we have made 9.2% ROI betting head to head, and although the season is short, there should be plenty of opportunity to make profits again this year.

This year provides us with three new teams. The Kings, who have been in the league previously, Argentina’s Jaguares and Japans Sunwolves. Punters may remember when the AFL introduced new teams and we cleaned up betting against and for them that season. We were able to accuretly calculate the ratings for those teams and I believe we will be very good at doing it again in Super Rugby.

Ive decided to analyse how the betting for Super Rugby has gone by round. Are more profits made at the start of the year or later in the season, and should one bet early in round 1?

Whilst I haven’t collected all of the data (some of the data was stored in the early years not including the round number), history has shown that it is indeed profitable betting early in the season as well as late.

Round#Bets#Won%Won$Bet$Profit%ROI
121838% $3,898.87 $230.646%
2231357% $3,954.10 $2,781.77 70%
322627% $3,837.74 -$1,873.25 -49%
4251560% $5,622.66 $865.7115%
5231148% $4,221.24 $1,505.22 36%
6261038% $5,432.59 -$139.92-3%
7281450% $5,850.57 $225.744%
8211152% $3,793.49 $231.246%
915427% $2,869.86 -$205.21-7%
1020945% $3,507.86 $9.260%
11221568% $5,394.50 $1,918.57 36%
12221045% $3,254.16 -$9.590%
1317953% $2,655.44 $1,376.47 52%
1414857% $2,490.03 $882.7835%
15191263% $3,051.56 $970.0632%
1615640% $2,009.16 -$635.48-32%
1714857% $2,800.74 $823.3529%
1818739% $4,048.24 -$228.74-6%
1911436% $1,539.91 -$220.13-14%
209444% $1,448.78 -$58.08-4%
214375%$904.49$112.2912%
2211100%$313.71$235.2975%
23100%$106.39-$106.39-100%

Its a small sample size no doubt, but there is no reason not to bet in round 1 in season 2016. So make sure you subscribe before Friday. Click here for all the details:
http://www.sportpunter.com/sports/rugby-union/

Posted in Model, Sport Models | Leave a comment

AFL Preseason begins with our predictions

1443879143543

The AFL 2016 season is set to begin today. Well at least the pre-season is. And once again Sportpujnter will be providing predictions for the upcoming season.

Predictions for tonights match between Hawthorn and Carlton is now on the website, but I do issue caution on betting these pre-season matches. Despite the model taking into consideration who is playing, coaches will often play a player out of regular position, or for a limited time on field to test a few options for the upcoming season. New and untried players will probably get a longer run on the field than normal. Carlton have listed a near full lineup, with only Patrick Cripps the obvious non inclusion. Whilst Hawthorn will be without key forwards Roughhead, Gunston and Rioli, as well as Shields, Burgoyne and Frawley. Results from pre season matches will not be included in our betting history.

Sportpunter’s AFL Model has long been providing profits. In fact 2015 was our 17th year of predicting AFL results. All years have seen a substantial profit with the exception of 2006 and 2008 which had a  loss. On average we have gained 11% ROI over the years.

We have made 12.1% ROI from 1589 bets since 2005 betting on the line, and 10.7% ROI from the last 2366 bets betting h2h since 1999. More recently the results have even been better with 15.5% ROI made betting the line in the last 7 years All the betting histories are shown here.

With 2015 now behind us, we are now offering subscriptions for 2016. Click here to view Sportpunter’s AFL model in 2016 and lets have another great year in Sportpunter’s most favourite model.

Posted in Model, Sport Models | Leave a comment

NBA week by week model analysis

NBA_CNNPhThe NBA season is set to start on Wednesday, and we’ve decided to analyse the model over the five years that we have been providing predictions for. In total line betting has made 1.6% ROI and totals 2.1% ROI. This might seem modest at first sight, but those who have bet the NBA model know very well that it performs significantly better than this in the first half of the season before fading away a little.

Shown below is a table showing how the line model has gone over the five years with the cumulative profit per week. IT shows that if one was to bet the first 7 weeks only, then you would have maximised the profit at a rate of 8.2% ROI. Pretty impressive stuff.

Weeks#Bets$Bet$Profit%ROICumulative ProfitCumulative %ROI
0144 $35,097.38 $3,770.76 10.7% $3,770.76 10.7%
1140 $31,262.10 $1,687.61 5.4% $5,458.37 8.2%
2141 $31,693.31 $544.371.7% $6,002.74 6.1%
3163 $31,697.51 $4,346.30 13.7% $10,349.04 8.0%
4159 $32,347.38 $2,576.83 8.0% $12,925.87 8.0%
5190 $35,919.29 $4,999.44 13.9% $17,925.31 9.1%
6156 $27,885.00 $949.033.4% $18,874.33 8.4%
7162 $27,684.63 $2,019.23 7.3% $20,893.57 8.2%
8149 $24,695.55 -$536.43-2.2% $20,357.14 7.3%
9155 $26,130.77 -$1,898.55 -7.3% $18,458.58 6.1%
10166 $26,827.77 -$3,681.82 -13.7% $14,776.76 4.5%
11154 $26,807.63 -$4,103.90 -15.3% $10,672.86 3.0%
12157 $24,779.09 -$724.31-2.9% $9,948.55 2.6%
13135 $23,163.47 $26.820.1% $9,975.37 2.5%
14153 $27,020.23 $3,733.58 13.8% $13,708.95 3.2%
15128 $21,970.03 $1,567.16 7.1% $15,276.11 3.4%
16121 $22,481.71 $1,351.89 6.0% $16,628.00 3.5%
17134 $22,787.58 $1,587.58 7.0% $18,215.58 3.6%
18142 $25,111.30 -$2,688.65 -10.7% $15,526.93 3.0%
19126 $20,627.74 -$2,653.09 -12.9% $12,873.84 2.4%
20135 $22,182.13 $6,486.85 29.2% $19,360.69 3.4%
21122 $19,564.15 -$2,459.52 -12.6% $16,901.17 2.9%
22115 $19,643.40 -$1,883.38 -9.6% $15,017.79 2.5%
23108 $21,002.29 $36.920.2% $15,054.71 2.4%
2459 $17,031.75 -$3,390.14 -19.9% $11,664.58 1.8%
2531 $6,400.16 -$765.19-12.0% $10,899.39 1.7%
2616 $2,088.13 -$587.60-28.1% $10,311.78 1.6%
2721 $4,382.50 $414.639.5% $10,726.42 1.6%
2815 $1,828.49 -$735.85-40.2% $9,990.56 1.5%
299 $1,287.70 $981.2176.2% $10,971.77 1.7%
304$401.21-$401.21-100.0% $10,570.56 1.6%
313$530.91$118.1322.3% $10,688.69 1.6%
328 $1,160.24 $111.199.6% $10,799.89 1.6%
333$623.02-$214.02-34.4% $10,585.86 1.6%

The table below does the same but for totals betting. It shows that 9 weeks in, and one maximises their profit at a rate of 5.5% ROI.

Weeks#Bets$Bet$Profit%ROICumulative ProfitCumulative %ROI
0133 $36,678.85 $3,793.24 10.3% $3,793.24 10.3%
1152 $35,169.15 $2,935.55 8.3% $6,728.79 9.4%
2140 $34,221.81 $211.730.6% $6,940.52 6.5%
3156 $34,752.20 $4,801.66 13.8% $11,742.18 8.3%
4153 $32,270.79 -$208.40-0.6% $11,533.78 6.7%
5188 $36,422.22 -$213.98-0.6% $11,319.80 5.4%
6153 $28,233.49 $1,699.51 6.0% $13,019.31 5.5%
7164 $27,363.86 $1,959.16 7.2% $14,978.47 5.6%
8139 $23,063.13 $1,948.20 8.4% $16,926.67 5.9%
9138 $23,552.54 $215.500.9% $17,142.16 5.5%
10140 $20,138.68 -$113.11-0.6% $17,029.06 5.1%
11133 $22,839.71 -$342.60-1.5% $16,686.46 4.7%
12153 $25,338.76 -$1,385.82 -5.5% $15,300.63 4.0%
13147 $22,224.16 -$3,770.56 -17.0% $11,530.08 2.9%
14156 $26,332.04 $1,392.00 5.3% $12,922.07 3.0%
15115 $19,445.00 -$3,272.16 -16.8% $9,649.91 2.2%
16106 $17,338.78 $249.761.4% $9,899.67 2.1%
17142 $21,448.25 $762.693.6% $10,662.36 2.2%
18136 $22,220.92 -$1,613.39 -7.3% $9,048.97 1.8%
19131 $23,672.51 -$2,328.43 -9.8% $6,720.54 1.3%
20127 $19,914.28 -$3,015.29 -15.1% $3,705.24 0.7%
21129 $21,908.55 $3,389.23 15.5% $7,094.47 1.2%
22101 $15,102.76 $2,050.30 13.6% $9,144.77 1.6%
2390 $13,244.98 -$127.89-1.0% $9,016.88 1.5%
2457 $11,847.01 $997.728.4% $10,014.59 1.6%
2545 $9,590.72 $1.050.0% $10,015.64 1.6%
2619 $4,101.96 -$262.63-6.4% $9,753.01 1.6%
2714 $1,543.45 -$327.82-21.2% $9,425.19 1.5%
2816 $2,382.66 -$22.45-0.9% $9,402.74 1.5%
2912 $2,478.60 $1,245.13 50.2% $10,647.87 1.7%
309 $1,848.79 -$689.06-37.3% $9,958.81 1.6%
315 $1,045.85 -$654.44-62.6% $9,304.37 1.5%
328 $1,774.95 -$58.33-3.3% $9,246.03 1.4%
333$545.54$72.5913.3% $9,318.62 1.5%

These week numbers of course are not be all and end all, and it will vary year to year. But they do give the punter an idea of when the model has done well in the past, and the obvious answer is from word go.

With the NBA season beginning Wednesday, you don’t want to miss a few weeks and hence miss out on all the action about when the model has traditionally performed the best.

All subscription details and prices are shown here.

Posted in Model, Sport Models | Leave a comment

NBL 2015/16 season set to start

NBL_Logo_2015Not only is NHL starting this Wednesday but so is NBL. NBL is the Australian Basketball league, and we have been predicting for this league since 2006. Our records show that we have made a 3.6% ROI from 867 bets betting h2h, and 9.9% ROI betting totals from 791 bets. Handicap betting has made 10.7% ROI in the last 4 years.

Predictions are given out at the latest at 5.30pm AEDT, or if there is an earlier match, an hour before start time.

Subscriptions are now open, and places will be limited. Details and betting histories are shown here: http://www.sportpunter.com/sports/basketball/nbl/

Posted in Blog, Gambling Blog | Leave a comment

NHL Season month by month analysis

NHLmymodAmerica’s Ice Hockey season is about to start, and as per normal, we will be producing predictions for the upcoming season. All in all we have predicted 3815 totals bets for a return of 6.1% ROI. Last year we made 3%, but the year before cleaned up with 13.1% ROI. Interestingly, by the end of January last year, the model was sitting on 18% ROI for the year.

We’ve done an analysis by month to show you how the model goes ever y month. Shown below is the graph, which shows that the model has traditionally kicked off very well averaging over 7% ROI in October (month 10). February came out break even (0% ROI, month 2), and months 4 and 5 were less that other months, maybe because of the variability in finals totals.

nhltotalsbymonth

So clearly, the model does well from day 1, and hopefully this trend will continue on 2015. Subscriptions are now available and places are limited and will be closed.

The NHL season starts this Wednesday. Subscription details and betting histories here: http://www.sportpunter.com/sports/ice-hockey/

Related Posts with Thumbnails
Posted in Model, Sport Models | Leave a comment