
 The NBA Season is just about to start and Sportpunter will be giving predictions every day for every match in 2016/17. Please note, that as shown below in our analysis, it is critical that you sign up and get the first few weeks of predictions, because – as we shall show below – they are the most important and most successful for our NBA model. Click here to sign up or view prices for Sportpunter’s NBA model for season 2016/17.
Ok, now onto the nitty gritty. Firstly h2h betting. The betting history shows us that we have made 2.8% ROI from 4000 bets since 2010/11 which is great going. However last year we made an incredible 6.8% ROI, and with some simple analysis as shown below we can increase that amount.
Analysis of profits week by week is shown below in the graph for head to head betting
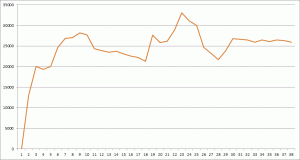
Clearly this shows that the majority of the profit has been made in the first 2 weeks. That’s right the first 2 weeks!. But profit also continues to rise until about week 22 to 24. This is generally a week or two just before playoffs. Whilst playoff profits have done well at 2.2% ROI, it’s the week or two beforehand that things don’t do that well. Mostly likely for this is because of teams motivation. Are certain teams not capable of making the playoffs? Maybe some teams have already secured a playoff position, and maybe some teams require every match critical.
I plan on doing more analysis on this, and hopefully by the time we come to 2-3 weeks out from playoffs, I will have upgraded the model to account for this. But if at this stage we don’t include the 2 weeks out from play offs, profits increase from 2.8% ROI up to 3.2% ROI, a slight but nice improvement.
For the line (or handicap betting) for NBA, I have included the profits (shown in brown) along with the amount bet(shown in green).
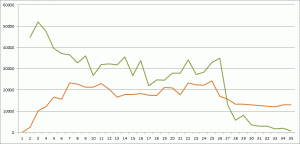
On first look, the amount bet clearly decreases as the season progresses, which indicates again that the big overlays occur at the start of the season. The brown line suggests again that most profits are made in the early weeks, and from weeks 10 to 24 have shown near even results. Inn week 25 (one week out from playoffs), a massive 20.7% loss has been made from 127 bets. Clearly, I recommend not betting this week until I can better improve the model. Playoffs have not recorded a profit either. From 227 bets a 10% ROI loss was made. A small sample, but something to be wary about as well. More on this to come with future analysis.
A similar graph has been made with totals betting as well as shown below.
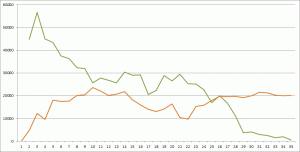
It also shows (with the green line) that the amount bet decreases as the season progresses. In that the biggest overlays occur at the start of the season. The brown line indicates this as well with profits increasing up till about week 10. Losses were made from then on until round 20, which follows by big profits up to the playoffs. The playoffs record is just over breakeven.
So based on the above, what are my recommendations? Clearly the first few weeks are critical to jumpon board the NBA models, and profits continue to increase until about 2 months in. From then, I will leave it up to you if you continue betting.
However, I highly recommend not betting h2h and line betting a few weeks out from the playoffs.
Make sure you sign up before the season starts. Subscriptions and price information is shown at this link. Best of Sport Punting luck!
 With over ten years of live betting history on the net, and large profits almost every year, the Sportpunter AFL model is the best anywhere to be seen. More than 10% ROI had been made and is on sale now at the
  Sportpunter's tennis model has been one of the longest running. Operating since 2003 it has made around 5% ROI over the years. And with many matches being played, it is a model that tennis betting enthusiasts need behind them.