AFL Preseason begins with our predictions

1443879143543

The AFL 2016 season is set to begin today. Well at least the pre-season is. And once again Sportpujnter will be providing predictions for the upcoming season.

Predictions for tonights match between Hawthorn and Carlton is now on the website, but I do issue caution on betting these pre-season matches. Despite the model taking into consideration who is playing, coaches will often play a player out of regular position, or for a limited time on field to test a few options for the upcoming season. New and untried players will probably get a longer run on the field than normal. Carlton have listed a near full lineup, with only Patrick Cripps the obvious non inclusion. Whilst Hawthorn will be without key forwards Roughhead, Gunston and Rioli, as well as Shields, Burgoyne and Frawley. Results from pre season matches will not be included in our betting history.

Sportpunter’s AFL Model has long been providing profits. In fact 2015 was our 17th year of predicting AFL results. All years have seen a substantial profit with the exception of 2006 and 2008 which had a  loss. On average we have gained 11% ROI over the years.

We have made 12.1% ROI from 1589 bets since 2005 betting on the line, and 10.7% ROI from the last 2366 bets betting h2h since 1999. More recently the results have even been better with 15.5% ROI made betting the line in the last 7 years All the betting histories are shown here.

With 2015 now behind us, we are now offering subscriptions for 2016. Click here to view Sportpunter’s AFL model in 2016 and lets have another great year in Sportpunter’s most favourite model.

Posted in Model, Sport Models | Leave a comment

NBA week by week model analysis

NBA_CNNPhThe NBA season is set to start on Wednesday, and we’ve decided to analyse the model over the five years that we have been providing predictions for. In total line betting has made 1.6% ROI and totals 2.1% ROI. This might seem modest at first sight, but those who have bet the NBA model know very well that it performs significantly better than this in the first half of the season before fading away a little.

Shown below is a table showing how the line model has gone over the five years with the cumulative profit per week. IT shows that if one was to bet the first 7 weeks only, then you would have maximised the profit at a rate of 8.2% ROI. Pretty impressive stuff.

Weeks#Bets$Bet$Profit%ROICumulative ProfitCumulative %ROI
0144 $35,097.38 $3,770.76 10.7% $3,770.76 10.7%
1140 $31,262.10 $1,687.61 5.4% $5,458.37 8.2%
2141 $31,693.31 $544.371.7% $6,002.74 6.1%
3163 $31,697.51 $4,346.30 13.7% $10,349.04 8.0%
4159 $32,347.38 $2,576.83 8.0% $12,925.87 8.0%
5190 $35,919.29 $4,999.44 13.9% $17,925.31 9.1%
6156 $27,885.00 $949.033.4% $18,874.33 8.4%
7162 $27,684.63 $2,019.23 7.3% $20,893.57 8.2%
8149 $24,695.55 -$536.43-2.2% $20,357.14 7.3%
9155 $26,130.77 -$1,898.55 -7.3% $18,458.58 6.1%
10166 $26,827.77 -$3,681.82 -13.7% $14,776.76 4.5%
11154 $26,807.63 -$4,103.90 -15.3% $10,672.86 3.0%
12157 $24,779.09 -$724.31-2.9% $9,948.55 2.6%
13135 $23,163.47 $26.820.1% $9,975.37 2.5%
14153 $27,020.23 $3,733.58 13.8% $13,708.95 3.2%
15128 $21,970.03 $1,567.16 7.1% $15,276.11 3.4%
16121 $22,481.71 $1,351.89 6.0% $16,628.00 3.5%
17134 $22,787.58 $1,587.58 7.0% $18,215.58 3.6%
18142 $25,111.30 -$2,688.65 -10.7% $15,526.93 3.0%
19126 $20,627.74 -$2,653.09 -12.9% $12,873.84 2.4%
20135 $22,182.13 $6,486.85 29.2% $19,360.69 3.4%
21122 $19,564.15 -$2,459.52 -12.6% $16,901.17 2.9%
22115 $19,643.40 -$1,883.38 -9.6% $15,017.79 2.5%
23108 $21,002.29 $36.920.2% $15,054.71 2.4%
2459 $17,031.75 -$3,390.14 -19.9% $11,664.58 1.8%
2531 $6,400.16 -$765.19-12.0% $10,899.39 1.7%
2616 $2,088.13 -$587.60-28.1% $10,311.78 1.6%
2721 $4,382.50 $414.639.5% $10,726.42 1.6%
2815 $1,828.49 -$735.85-40.2% $9,990.56 1.5%
299 $1,287.70 $981.2176.2% $10,971.77 1.7%
304$401.21-$401.21-100.0% $10,570.56 1.6%
313$530.91$118.1322.3% $10,688.69 1.6%
328 $1,160.24 $111.199.6% $10,799.89 1.6%
333$623.02-$214.02-34.4% $10,585.86 1.6%

The table below does the same but for totals betting. It shows that 9 weeks in, and one maximises their profit at a rate of 5.5% ROI.

Weeks#Bets$Bet$Profit%ROICumulative ProfitCumulative %ROI
0133 $36,678.85 $3,793.24 10.3% $3,793.24 10.3%
1152 $35,169.15 $2,935.55 8.3% $6,728.79 9.4%
2140 $34,221.81 $211.730.6% $6,940.52 6.5%
3156 $34,752.20 $4,801.66 13.8% $11,742.18 8.3%
4153 $32,270.79 -$208.40-0.6% $11,533.78 6.7%
5188 $36,422.22 -$213.98-0.6% $11,319.80 5.4%
6153 $28,233.49 $1,699.51 6.0% $13,019.31 5.5%
7164 $27,363.86 $1,959.16 7.2% $14,978.47 5.6%
8139 $23,063.13 $1,948.20 8.4% $16,926.67 5.9%
9138 $23,552.54 $215.500.9% $17,142.16 5.5%
10140 $20,138.68 -$113.11-0.6% $17,029.06 5.1%
11133 $22,839.71 -$342.60-1.5% $16,686.46 4.7%
12153 $25,338.76 -$1,385.82 -5.5% $15,300.63 4.0%
13147 $22,224.16 -$3,770.56 -17.0% $11,530.08 2.9%
14156 $26,332.04 $1,392.00 5.3% $12,922.07 3.0%
15115 $19,445.00 -$3,272.16 -16.8% $9,649.91 2.2%
16106 $17,338.78 $249.761.4% $9,899.67 2.1%
17142 $21,448.25 $762.693.6% $10,662.36 2.2%
18136 $22,220.92 -$1,613.39 -7.3% $9,048.97 1.8%
19131 $23,672.51 -$2,328.43 -9.8% $6,720.54 1.3%
20127 $19,914.28 -$3,015.29 -15.1% $3,705.24 0.7%
21129 $21,908.55 $3,389.23 15.5% $7,094.47 1.2%
22101 $15,102.76 $2,050.30 13.6% $9,144.77 1.6%
2390 $13,244.98 -$127.89-1.0% $9,016.88 1.5%
2457 $11,847.01 $997.728.4% $10,014.59 1.6%
2545 $9,590.72 $1.050.0% $10,015.64 1.6%
2619 $4,101.96 -$262.63-6.4% $9,753.01 1.6%
2714 $1,543.45 -$327.82-21.2% $9,425.19 1.5%
2816 $2,382.66 -$22.45-0.9% $9,402.74 1.5%
2912 $2,478.60 $1,245.13 50.2% $10,647.87 1.7%
309 $1,848.79 -$689.06-37.3% $9,958.81 1.6%
315 $1,045.85 -$654.44-62.6% $9,304.37 1.5%
328 $1,774.95 -$58.33-3.3% $9,246.03 1.4%
333$545.54$72.5913.3% $9,318.62 1.5%

These week numbers of course are not be all and end all, and it will vary year to year. But they do give the punter an idea of when the model has done well in the past, and the obvious answer is from word go.

With the NBA season beginning Wednesday, you don’t want to miss a few weeks and hence miss out on all the action about when the model has traditionally performed the best.

All subscription details and prices are shown here.

Posted in Model, Sport Models | Leave a comment

NBL 2015/16 season set to start

NBL_Logo_2015Not only is NHL starting this Wednesday but so is NBL. NBL is the Australian Basketball league, and we have been predicting for this league since 2006. Our records show that we have made a 3.6% ROI from 867 bets betting h2h, and 9.9% ROI betting totals from 791 bets. Handicap betting has made 10.7% ROI in the last 4 years.

Predictions are given out at the latest at 5.30pm AEDT, or if there is an earlier match, an hour before start time.

Subscriptions are now open, and places will be limited. Details and betting histories are shown here: http://www.sportpunter.com/sports/basketball/nbl/

Posted in Blog, Gambling Blog | Leave a comment

NHL Season month by month analysis

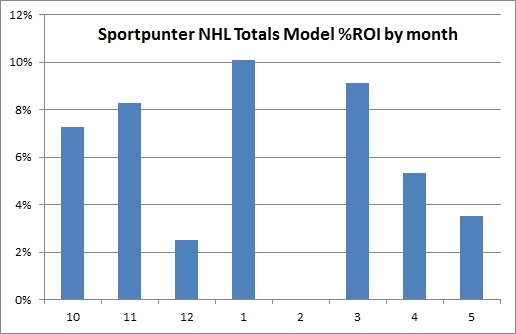
NHLmymodAmerica’s Ice Hockey season is about to start, and as per normal, we will be producing predictions for the upcoming season. All in all we have predicted 3815 totals bets for a return of 6.1% ROI. Last year we made 3%, but the year before cleaned up with 13.1% ROI. Interestingly, by the end of January last year, the model was sitting on 18% ROI for the year.

We’ve done an analysis by month to show you how the model goes ever y month. Shown below is the graph, which shows that the model has traditionally kicked off very well averaging over 7% ROI in October (month 10). February came out break even (0% ROI, month 2), and months 4 and 5 were less that other months, maybe because of the variability in finals totals.

nhltotalsbymonth

So clearly, the model does well from day 1, and hopefully this trend will continue on 2015. Subscriptions are now available and places are limited and will be closed.

The NHL season starts this Wednesday. Subscription details and betting histories here: http://www.sportpunter.com/sports/ice-hockey/

Posted in Model, Sport Models | Leave a comment

Australia and Off Shore Bookmakers

why-you-should-bet-on-australian-sports-xlGustov Johansson from Sweden doesn’t mind a bet. He reckons that Norrköping are a sure thing against Helsingborg in the Sweedish Allsvenskan soccer league. So he decides to make a $100 bet at Crownbet, an Australian owned and located company. Unfortunately, his bet wasn’t successful and he losses the $100 after Helsingborg went on a goal kicking rampage. “Jävla” says Gustov.

But what exactly happens to that money? Crownbet pocket the $100 and then over the long term will pay the Australian government part of it through taxes. How much do Crownbet give to the Sweedish governement?

Zero

Despite it being sweedish money that was bet, the transaction occured in Australia, so Sweeden get didily-squat, and poor Gustov is $100 poorer for the effort.

So why then are the Australian government thinking about banning international bookmakers who dont pay tax? If Australian bookmakers dont pay tax on winnings to international governments, then why should international bookmakers pay tax to Australian governments?

I thought the liberal, current Austarlian governemnt were all about free trade and open borders? Because as most liberals will say, free trade encourages growth and competition.

That is 100% true. Punters are turning to international bookmakers because they can provide a better service than the Australian bookmakers. When Tabcorp say that ”Unlicensed offshore operators are not regulated to Australian standards and that poses risks to consumers and the integrity of sport and racing”, what they really mean is ”we want to stop Australians betting overseas because they are competition”.

Yes thats right, Australian bookmakers want international bookmakers banned because they encourage growth and competition. Greater competition means that the Australian bookmakers will have to tighten their screws. Australian bookmakers are against free trade and want closed borders. The liberal government should be strongly against this.

And as punters, we should also be strongly against the ban of international bookmakers. We want free trade, competition and growth. The ability for us to spend our money however we see fit, and not be told by the government what cornershops we can and can’t buy from, should be high on our agendas.

Imagine if the government told us that we can’t buy anything from ebay that came from China because they dont pay Australian tax. There would be outrage. So outraged us punters should be if any restrictions on international bookmakers occur.

Posted in Blog, Gambling Blog | Leave a comment

Sportpunter’s NFL Season 2015 analysis

nfl-online-e1427242784519The NFL Season is set to start this Thursday and once again we will be providing predictions for the entire season. Whilst our betting history shows some really good figures – making 1.8% ROI betting the line over five seasons and making 5.8% ROI betting totals, with each season being a winner – analysis of the results prove that there is more to it than that.

We stated before the start of last season, that by waiting until round 6 to bet totals, and a little later for line betting can drastically increase your profit over the season. And had you followed this the you would have made an incredible 15% ROI last year betting on totals.

In fact, we’ve decided to do some analysis into how the model has gone over the five years based on round. Shown here are the results for totals betting and line betting alike.

It shows that betting from approximately rounds 3 to 6 show the greatest profit. That said betting from the word go isn’t that much less than waiting a few rounds. When looking at how the model has gone when waiting until round 6 (as previously prescribed), it shows a significant increase in profit in all years but 2011. For three years in a row the model has made over 13% ROI each year.

There can be no doubt that the totals model for NFL is indeed very profitable.

As for line betting, the results aren’t quite as good but still very profitable indeed. It seems that line betting is a little more variable. A 1.8% ROI profit could have been made betting from word go, however if one was to wait until round 11, then a 5.8% ROI profit could have been made and a little higher profit betting only the second half of the year.

Analysis by year shows that when waiting until round 11, 2011 and 2013 making massive profits in excess of 20% ROI+, however 2012 losing by about the same margin. 2010 made 4% and last year broke around even. Such variability is understandable when we are talking about less than 100 bets a year waiting for round 11.

That being said, totals betting shows clearly amazing results, whilst line betting is profitable, although somewhat more variable.

Hopefully we will have another fantastically profitable 2015.
Subscription information is shown here for the 2015 season.

Posted in Model, Sport Models | Leave a comment

Australia to change Interactive Gambling Act

online-gambling-law-australiaThe Australian Interactive Gambling Act that was passed in 2001 by then Prime Minister John Howard is in dire need of an update. The Act was created before smartphones were common place, and when the internet was in its infancy.

In play gambling was determined to be illegal, unless one rang up the bookmaker. Seems like a strange rule indeed, but one of the reasons why this was the case, is that the government were scared that digital TV could display odds whilst a sports game was in-play, and that TV viewers could simply use their remote controls to place a bet.

Kerry Packer was all over it.

So this clearly outdated law was put in place. The world has changed remarkably since. And recently there has been a push for the Interactive Gambling Act to be updated. Makes Sense.
Financial Counselling Australia recently brought out a report about problem gambling, concluding amongst other things, that bookmakers giving credit to punters should be outlawed and that every bookmaker should have a opt out option. I’m all for that.

But it seems that whenever laws need to be changed, vested interests come to the fore. More recently, at least according to media reports, limiting or banning Australian punters from betting offshore could well be put into the equation. I don’t need to tell you what bookmakers we are talking about either – just think Asia, Caribbean, USA and Europe, probably in that order.

Tabcorp has come out swinging. They said that “The rise of unlicensed offshore betting in Australian racing and sport needs to be addressed.” Sure but why? They continue, “Unlicensed offshore operators are not regulated to Australian standards and that poses risks to consumers and the integrity of sport and racing”

Ahh so I get it. Tabcorp are only interested in the welfare of Australian punters? The same punters that they earn a living taking money off? The same punters that they will happily allow problem gamblers bet their life away? The same punters that they are happy to give whatever credit they want to punters who clearly have no means to pay it back?

Give me a break. Tabcorp, and presumably all other Australian bookmakers, want to restrict Australian punters access to offshore bookmakers because they want to eradicate competition. Nothing more, nothing less. For them it is a pure business decision.

Sure they might be slightly upset that these offshore companies, whilst not being allowed to advertise in Australia, are not paying their due taxes to the government, but answer this question, Why would a punter in Australia bet offshore anyway?

The answer is simple. They provide a better service.

Either their odds are better, or they are allowed to bet, or they are not banned or limited. If Australian corporate bookmakers didn’t ban, limit or reduce odds for Australian punters, then I’d say we’d be quite happy betting into the Australian websites. However this is not the case.

Corporate bookmaking Australia wants to ban successful Australian punters and then ban them from betting anywhere else. How’s that for a free country?

Clearly the Interactive Gambling Act needs to be changed and updated, but if only the Corporate bookmakers have a say in it, this is no doubt what will happen.
Posted in Blog, Gambling Blog | Leave a comment

College Football Model

American Football Close up on Field with yard lines in the distance

American Football Close up on Field with yard lines in the distance

The College Football season has started, and once again we will be providing predictions for free. Last year was our first year and results were mixed. Whilst h2h betting and line betting lost, totals came out slightly ahead. We’ve done a quick analysis of line betting and totals and results are shown below.

Totals betting seemed to work better with a minimum overlay of 7.5%. This would make the results record a 1.5% ROI. Keep in mind that we are talking about one season here and only 306 bets, so it is hard to say with any certainty about the patterns that we are attempting to find to maximise our profits. Interestingly, we can also look at the days since the first date of the season.

In the first 2 weeks (up until day 14), the totals model was losing at a rate of 21% ROI from 65 bets. After this is showed great form in the middle season making 6.2% ROI from 241 bets from week 3 onwards. This is good news, it could well be that the model takes a little while to get used to the new teams each season. Keep note that the last 2 sections, over 2 months since the season started, recorded losses , but with a sample size of just 43, it’s hard to draw any concrete conclusions here.

Unfortunately line betting failed to show any real profits from anyway of looking at it. We will continue to monitor and make predictions for head to head, line and totals betting, and hopefully do better at it this season. Analysis of totals and line betting are shown in these links.

Predictions are free, and the competition starts today! Details here

Posted in Model, Sport Models | Leave a comment

MLB Season set to start

mlb-scheduleThe American Baseball season (MLB) starts on Sunday the 5th of April and once again Sportpunter are providing predictions. Last year was the first year that our model went live and the results were fantastic, especially in totals betting.

Shown below is our analysis of the year that has gone, with totals betting first. Some people might want to analyse only the figures from when the model started giving predictions live (from 7/5/14), however I believe a greater reflection of how the model has gone will include up until the start of last year’s season, which is shown first.

Odds#Bets$Bet$Profit%ROI
11.8538 $4,346.22 -$475.96-11%
1.851.9170 $19,790.57 -$281.31-1%
1.91.92582 $9,371.17 $940.4710%
1.9251.9578 $9,036.61 $1,240.14 14%
1.951.975127 $14,100.37 $349.712%
1.975261 $6,652.50 $978.2515%
22.05226 $25,237.01 $4,319.99 17%
2.052.1119 $14,299.52 $2,456.89 17%
2.12.1535 $3,784.10 $1,013.90 27%
2.151020 $2,943.54 $1,309.35 44%
956 $109,561.61 $11,851.43 11%
Prob#Bets$Bet$Profit%ROI
00.58$569.17$150.7526%
0.50.52573 $4,797.13 $1,203.11 25%
0.5250.5375109 $8,405.63 $1,112.28 13%
0.53750.55125 $10,945.58 $2,825.51 26%
0.550.56134 $12,743.37 -$5.010%
0.560.575192 $20,246.63 $3,085.10 15%
0.5750.5875108 $13,259.85 -$157.42-1%
0.58750.688 $13,355.95 -$21.060%
0.60.62578 $14,796.80 $1,968.86 13%
0.6251041 $10,441.50 $1,689.31 16%
956 $109,561.61 $11,851.43 11%
Overlay#Bets$Bet$Profit%ROI
00.06105 $6,008.86 $414.727%
0.060.07129 $8,751.96 -$46.79-1%
0.070.0899 $7,958.78 $1,303.07 16%
0.080.0986 $7,627.48 $434.506%
0.090.174 $7,288.95 $466.526%
0.10.125181 $20,935.62 $2,640.70 13%
0.1250.1596 $13,382.22 $1,218.35 9%
0.150.2118 $21,012.41 $3,268.94 16%
0.20.2547 $10,402.29 -$594.42-6%
0.251021 $6,193.04 $2,745.84 44%
956 $109,561.61 $11,851.43 11%
Since 7/5/14
Odds#Bets$Bet$Profit%ROI
11.8532 $3,532.54 -$418.37-12%
1.851.9143 $16,522.32 $949.416%
1.91.92561 $6,720.22 $1,569.42 23%
1.9251.9546 $5,198.74 $552.0311%
1.951.975115 $12,808.17 -$25.010%
1.975245 $4,671.86 $188.984%
22.05175 $19,024.43 $2,273.49 12%
2.052.181 $9,566.19 $561.956%
2.12.1515 $1,608.14 -$40.97-3%
2.15103$341.33$251.8574%
716 $79,993.94 $5,862.78 7%
Prob#Bets$Bet$Profit%ROI
00.53$227.79$109.6848%
0.50.52552 $3,162.19 $663.3121%
0.5250.537581 $5,981.78 $11.680%
0.53750.5588 $7,283.20 $1,451.28 20%
0.550.56101 $9,437.26 -$786.77-8%
0.560.575153 $16,018.51 $1,622.57 10%
0.5750.587586 $10,237.95 -$633.76-6%
0.58750.666 $9,849.64 $452.905%
0.60.62559 $10,817.39 $1,071.17 10%
0.6251029 $7,134.45 $1,955.65 27%
718 $80,150.16 $5,917.71 7.4%
Overlay#Bets$Bet$Profit%ROI
00.0687 $4,973.90 $494.1810%
0.060.07104 $7,020.64 -$373.20-5%
0.070.0877 $6,221.14 $1,053.23 17%
0.080.0967 $6,011.34 -$161.03-3%
0.090.156 $5,563.27 -$262.71-5%
0.10.125128 $14,952.39 $2,022.61 14%
0.1250.1574 $10,357.82 $427.284%
0.150.286 $15,577.51 $1,680.80 11%
0.20.2529 $6,474.05 -$78.66-1%
0.251010 $2,998.10 $1,115.21 37%
718 $80,150.16 $5,917.71 7%

As you can see from above, the totals model has done extremely well. From 956 bets it has made 11% ROI which is massive considering the large amount of turnover possible. At first glance it would seem that betting on odds under 1.90 might not be profitable, but this could well be due to a small sample size, and I wouldn’t look too much into that.

What is promising is that larger overlays have resulted in larger profits which is a good indication that we are modelling the data well. The model seemed to go better early in the season than later.

H2H betting was different. Before we went live, the h2h model suffered badly in the opening month, however since we went live on 7/5/15, it made 3% ROI from 906 bets. It would seem betting on odds lower than 2.10 was no profitable however once again this was a small sample size.

Odds#Bets$Bet$Profit%ROI
11.8541 $3,894.74 -$599.95-15%
1.852104 $9,357.18 -$607.20-6%
22.192 $8,078.10 -$610.50-8%
2.12.2143 $12,130.31 $1,151.81 9%
2.22.3155 $13,152.82 $863.557%
2.32.4147 $12,260.37 $643.195%
2.42.5130 $10,654.11 -$1,140.18 -11%
2.52.65150 $13,661.56 -$377.43-3%
2.652.85100 $9,707.37 $1,383.73 14%
2.851072 $7,143.16 -$489.50-7%
1134 $100,039.72 $217.520%
Prob#Bets$Bet$Profit%ROI
00.450 $3,494.67 -$600.78-17%
0.40.42597 $6,680.18 $982.4415%
0.4250.45132 $9,617.66 $1,176.73 12%
0.450.475233 $19,591.29 -$41.070%
0.4750.5176 $15,115.73 -$709.75-5%
0.50.525191 $18,241.20 $52.920%
0.5250.5593 $9,176.16 -$816.77-9%
0.550.57588 $9,962.11 $1,075.76 11%
0.5750.642 $4,520.34 $51.641%
0.61032 $3,640.38 -$953.60-26%
1134 $100,039.72 $217.520%
Overlay#Bets$Bet$Profit%ROI
00.06122 $5,964.95 $1,650.12 28%
0.060.07121 $7,109.54 $307.364%
0.070.08127 $8,173.63 -$290.06-4%
0.080.0992 $6,414.14 -$724.60-11%
0.090.191 $7,013.12 $205.193%
0.10.125179 $15,509.71 -$175.23-1%
0.1250.15123 $12,575.62 -$659.58-5%
0.150.2152 $17,860.44 $754.724%
0.20.2574 $10,249.03 -$1,795.17 -18%
0.251053 $9,169.54 $944.7710%
1134 $100,039.72 $217.520%
Since 7/5/14
Odds#Bets$Bet$Profit%ROI
11.8522 $2,014.55 -$305.31-15%
1.85275 $6,473.51 -$19.850%
22.171 $6,395.37 -$794.22-12%
2.12.2121 $10,493.00 $1,528.31 15%
2.22.3129 $11,277.59 $1,063.72 9%
2.32.4122 $10,174.08 $1,650.08 16%
2.42.5106 $9,003.94 -$1,124.94 -12%
2.52.65118 $10,967.58 -$1,637.87 -15%
2.652.8586 $8,518.00 $1,506.63 18%
2.851056 $5,742.07 $662.6312%
906 $81,059.69 $2,529.18 3%
Prob#Bets$Bet$Profit%ROI
00.439 $2,740.64 -$183.70-7%
0.40.42576 $5,240.23 $571.6111%
0.4250.45105 $7,923.16 $449.156%
0.450.475195 $16,756.90 $819.865%
0.4750.5144 $12,101.96 -$302.84-3%
0.50.525155 $15,342.38 $751.235%
0.5250.5580 $8,101.00 -$690.64-9%
0.550.57573 $8,556.03 $1,478.52 17%
0.5750.624 $2,520.99 $211.018%
0.61016 $1,840.21 -$638.83-35%
907 $81,123.50 $2,465.37 3%
Overlay#Bets$Bet$Profit%ROI
00.0691 $4,355.66 $1,255.21 29%
0.060.0788 $5,040.71 $469.389%
0.070.08100 $6,380.88 -$620.86-10%
0.080.0973 $5,044.15 -$642.68-13%
0.090.173 $5,624.55 $400.087%
0.10.125139 $11,978.96 $204.362%
0.1250.15102 $10,308.79 -$52.01-1%
0.150.2131 $15,423.75 $1,122.89 7%
0.20.2560 $8,378.27 -$706.45-8%
0.251049 $8,523.97 $1,099.26 13%
906 $81,059.69 $2,529.18 3%

Please note that half way through the season, an upgrade of pitcher ratings was included so that pitcher ratings can change more quickly and dynamically for new pitchers. Preseason data was not taken into account, and it will be this year, so hopefully we should be able to see better h2h results, especially early on in the season.

Either way, it has been a standout year for Sportpunter’s MLB model, and I am very excited to get on board for when it starts this Sunday.

To sign up or view the betting history for MLB click here to the Sportpunter MLB website.

Posted in Model, Sport Models | Leave a comment

AFL Season set to start this Thursday

614969-8cf86840-461e-11e4-9bb4-d8c2ecaf4782The AFL season starts this Thursday and once again Sportpunter will be making predictions for it every weekend. No doubt that the AFL is our number 1 model, and the results are there to prove it.

As shown on this betting history link, we have made 12.5% ROI from 1431 bets since 2005 betting on the line, and 11% ROI from the last 2258 bets betting h2h since 1999. More recently the results have even been better with 16.2% ROI made betting the line in the last 6 years.

Last year we wrote an article saying that the period where most profit is made is in the first few weeks, so now would be a great time to get on board before the season starts on Thursday.

Get all the info and subscription option on the Sportpunter AFL webpage

Related Posts with Thumbnails
Posted in Model, Sport Models | Leave a comment