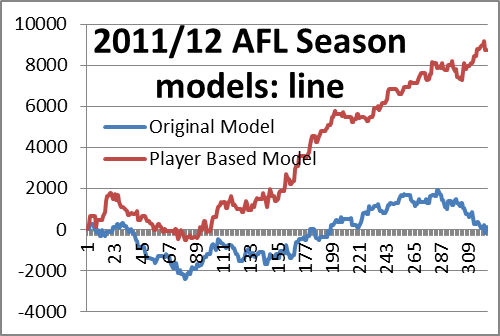
 We previously talked about the difference between the original model and the player based model as discussed before. But today, we will outline the 4 games with the biggest difference in probabilities and why. So here they are.
4. Western Bulldogs vs. Sydney. Round 21,2012. At a finishing line of +49.5, our old model rated the bulldogs a 69.8% chance to cover the line. And why not, they are playing at home after all. However, Hargrave was suspended, and five other players were taken out of the side. The reason was basically because of their thrashing against Richmond the week before where they lost by 70 points. But it wasn’t just that game, they were slaughtered against North by 56 points the week before that and destroyed by St. Kilda by 76 points the week before that too.
To say that their team was a little decimated, with young inexperienced players bouncing around the park would be an understatement. The dogs had no reason to win, and instead were trying out new players, whilst some of the older players were either injured or running around in the seconds out of form.
The player based model rated them only a 38.4% chance to cover the 49.5 points. So what turned out to be a significant bet for the western bulldogs, was a significant bet for the swans when player performance was taken into consideration. In the end the bulldogs lost by 82 points, and that after they were ahead at quarter time by 3 goals. Even Ryan Griffen’s 47 possessions couldn’t help them that day.
3. Essendon v Hawthorn, Round 18, 2012.
Essendon were at this stage 11 wins and only 5 losses for the year, but in recent time they had become more suspect. A surprise loss to Melbourne, a 71 point loss to the saints and a 67 point loss to Geelong the week before signalled that something might be up. Hawthorn had just won 7 matches in a row, including thrashings against Collingwood and Carlton at an amazing percentage of 230%. In those 7 matches they had racked up 984 points to their oppositions score of just 427.
The Essendon team had cracks all throughout their line up with injuries, and Dyson and Myers were both withdrawals. Hawthorn skipper Luke Hodge came back into the side as did defending quarterback Brent Guerra. They were replaced by benchwarmers Murphy and Cheney.
The final line of 35.5 (pushed out from 31.5) saw no bet on the original model, but on the player based model, we rated Essendon only a 15% chance to break it. They didn’t get close. In fact they were 43 points down by quarter time, and ended up losing by 94 points. An easy big win for the player based model.
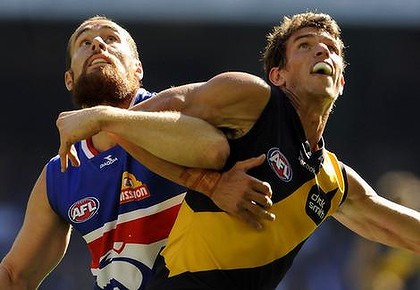
2. Carlton v Richmond, Round 18, 2012
The line here started at 6.5, but went out to 11.5 by the start of the game, which gave our model a 65.7% chance of covering it. Both teams came into this match in haphazard form. Richmond had no real changes to a team that was competitive but just kept losing matches, whilst Carlton welcomed back Kreuzer and Lucas for the expense of Bower, Russell, and Duigan. Our player based model had Carlton at only a 36% chance of covering.
So what started as a reasonable bet for Carlton at 11.5, finished as a reasonable bet for Richmond based on players. The final result was Carlton by 4 points. You can’t win them all.
1. And the number one match that had the biggest influence for the new player based model was indeed a match that uses the teams above late in the 2012 season. Richmond v Western Bulldogs, Round 20. We’ve already said why the western bulldogs were down and out. Dalhaus and Cross were out of the side from the week before, which made their line up look even more weak. Richmond has just had an impressive 48 point win against Brisbane up at the Gabba. With the exclusion of Foley, who was out for the year, the Tigers had a full strength side. The -35.5 point handicap (which ended at -40.5) originally suggested a big sized bet for the dogs, but under the player based model, we gave the tigers a 73% chance to beat it. The Tigers ended up winning easily by 70 points.
What is interesting, is that 3 of the top 4 matches included big one sided matches, no doubt, due to injury concerns of players, and all of them occurred late in the season. The one losing bet was marginal, whilst the big favorites came through with the other bets.
This tells me that the player based model might be doing a few extra things than just measuring the calibre of the players. It might as well also measure the overall teams performance better later in the season when certain teams have little incentive to win matches. Whilst Richmond could not have made finals, their morale must surely have been higher in the latter half of the year than the western bulldogs that were clearly just going through the motions.
Similarly with the Hawthorn v Essendon game. Whilst Hawthorn were up and about, they came in perfect timing to opposition Essendon who were showing some weakness, not only on their performances but also on their availability list.
Subscriptions for the 2013 AFL season is now available. These prices will go up by 50% on the 1st of March, so get in before then. Details as shown here: http://www.sportpunter.com/sports/afl/

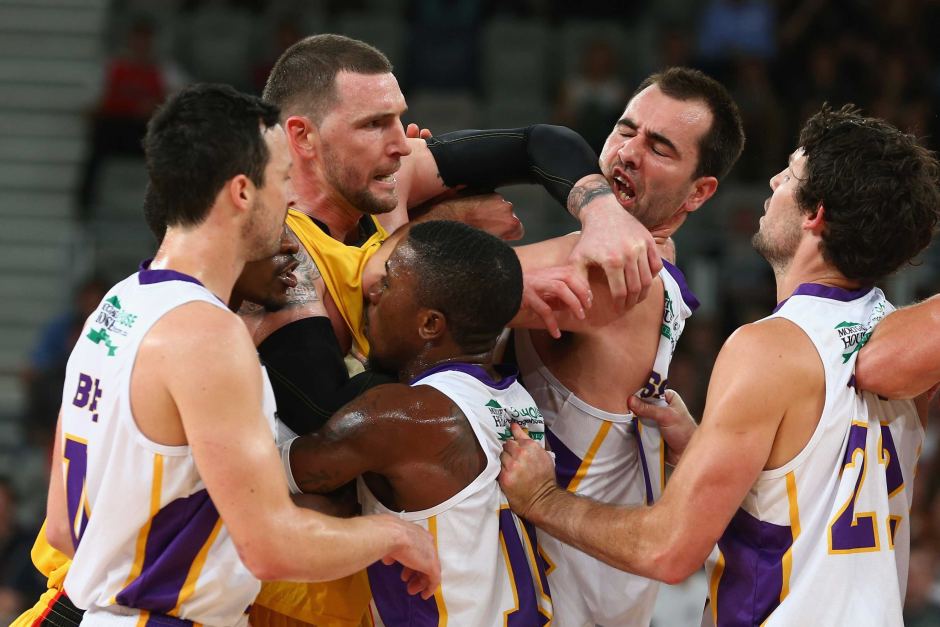 With the Australian Basketball NBL Season 2013/14 set to start on Thursday, we thought we’d take a look at the new rules that should allow higher scoring matches to occur.
 The NBL, Australian Basketball, starts on Thursday with reigning three time champions hosting Wollongong. And once again Sportpunter will be giving predictions for every match.
 How much of a home ground advantage is there in an AFL Grand Final?
 The NFL 2013/14 Season is about to start Thursday night with the Denver hosting Baltimore and Sportpunter will be providing predictions again. This will be our fourth year predicting the NFL and results are positive.
 Whilst the AFL are deliberating about what penalties to hand down to Essendon, there is talk about if Essendon should lose their premiership points and give up the year, so as not to lose draft picks the following years.
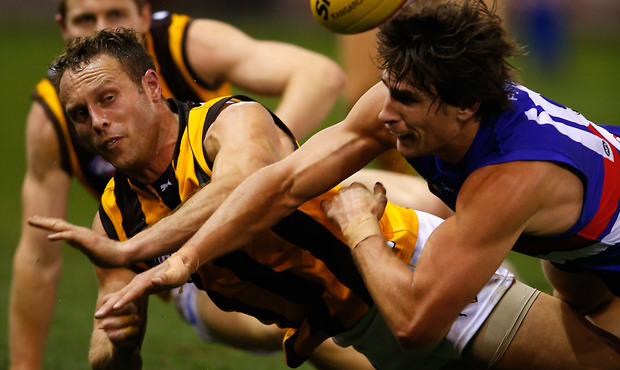 You can’t get a better example than this. Western Bulldogs were coming into this match the big outsiders against the Hawks this Friday night at Ethiad Stadium. And why not? They had lost 11 games in a row at the end of the 2012 season, and Hawthorn, perceived as much to be the best team in the competition just lost the flag to the Swans.
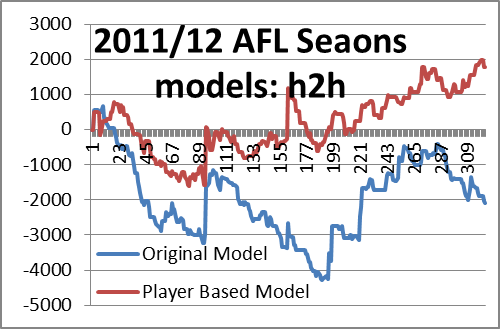
 With over ten years of live betting history on the net, and large profits almost every year, the Sportpunter AFL model is the best anywhere to be seen. More than 10% ROI had been made and is on sale now at the
  Sportpunter's tennis model has been one of the longest running. Operating since 2003 it has made around 5% ROI over the years. And with many matches being played, it is a model that tennis betting enthusiasts need behind them.