
Soccer under betting minimum overlays based on League Level

soccer7

In a previous article we looked at how the soccer model goes betting totals for different groups based on popularity. Results showed that less popular leagues were in fact more profitable than popular leagues. The results was not as extreme as head to head betting, as still good profits were made in all divisions.

Considering that most people know that unders betting usually performs better than overs betting in most sports, it would be interesting to determine how the unders and overs has gone separately for soccer per group.

Shown below is how the unders totals betting as gone per group and for different overlays.

Unders
Group1Overlay#Bets#Won%Won$Bet$Profit%ROI
00.07523512955% $15,507.02 $1,484.42 10%
0.0750.11647948% $14,830.78 -$716.57-5%
0.10.1251397050% $16,378.79 $471.063%
0.1250.151024544% $14,649.70 -$1,292.21 -9%
0.150.175823441% $13,926.60 -$1,622.82 -12%
0.1750.2583459% $11,135.08 $2,015.61 18%
0.20.225473166% $10,377.52 $3,570.44 34%
0.2250.25392256% $9,435.56 $2,047.69 22%
0.250.3644164% $17,537.95 $6,104.01 35%
0.3100492143% $16,939.85 -$1,035.24 -6%
TOTAL97950652% $140,718.85 $11,026.39 7.8%
Group2Overlay#Bets#Won%Won$Bet$Profit%ROI
00.07535017751% $23,236.71 -$14.490%
0.0750.131415850% $29,054.18 $481.822%
0.10.1252099947% $24,645.08 -$47.200%
0.1250.151819452% $25,850.62 $2,312.97 9%
0.150.1751346448% $22,964.99 $290.371%
0.1750.21186555% $22,338.60 $3,131.25 14%
0.20.225673045% $14,334.52 -$107.36-1%
0.2250.25492551% $12,156.31 $1,522.49 13%
0.250.3542750% $15,117.55 $41.080%
0.3100582950% $20,231.79 $2,384.90 12%
TOTAL153476850% $209,930.35 $9,995.83 4.8%
Group3Overlay#Bets#Won%Won$Bet$Profit%ROI
00.07526414455% $18,023.91 $1,718.40 10%
0.0750.11789352% $17,073.77 $815.875%
0.10.1251377152% $16,845.12 $364.972%
0.1250.151205949% $17,273.23 $93.711%
0.150.1751105146% $18,653.02 -$570.05-3%
0.1750.2704057% $13,564.66 $2,719.88 20%
0.20.225361747% $7,603.66 $470.496%
0.2250.25231357% $5,613.94 $857.0315%
0.250.3261142% $6,441.79 -$128.40-2%
0.3100321959% $9,965.40 $3,292.17 33%
TOTAL99651852% $131,058.50 $9,634.07 7.4%
Group4Overlay#Bets#Won%Won$Bet$Profit%ROI
00.075903842% $6,452.71 -$1,417.26 -22%
0.0750.1733447% $7,386.66 -$474.14-6%
0.10.125612744% $7,626.83 -$854.81-11%
0.1250.15442557% $6,374.95 $829.0513%
0.150.175322063% $5,187.82 $1,450.40 28%
0.1750.2241458% $4,277.27 $1,005.09 23%
0.20.22513862% $2,773.08 $772.7528%
0.2250.257343% $1,609.78 -$183.87-11%
0.250.3161169% $3,645.09 $1,905.44 52%
0.31005240% $1,467.09 $165.9411%
TOTAL36518250% $46,801.28 $3,198.59 6.8%
Group5Overlay#Bets#Won%Won$Bet$Profit%ROI
00.075321650% $2,430.49 -$140.08-6%
0.0750.1261973% $2,320.74 $1,081.39 47%
0.10.125261454% $3,290.30 -$107.40-3%
0.1250.1520945% $2,784.82 $71.753%
0.150.17511436% $1,767.15 -$248.65-14%
0.1750.211873% $1,927.38 $924.7948%
0.20.22511764% $2,551.10 $861.5534%
0.2250.2522100%$417.65$488.73117%
0.250.34125%$992.15-$100.17-10%
0.31006467% $3,034.96 $641.3321%
TOTAL1498456% $21,516.74 $3,473.24 16.1%

Total unders results has been very good, with results spread evenly around the 4.8% ROI mark to 7.8% ROI mark between groups 1 and 4. Group 5 recorded a 16.1% ROI mark however this involves a small sample size.

For Group1, overlays less than 17.5% were not profitable, however the higher overlays recorded amazingly good results.

Group 2 shows profits throughout the ranges, as does Group 3, whilst Group 3 looks non profitable below a 12.5% overlay.

So what to do? Well I guess its up to the individual, but one method might be to keep the minimum overlay at 17.5% for Group1, and at 12.5% for all the other groups.

If one were to undertake this, then over the period since the start of last year, one would have bet 1541 bets, which is 38.3% of the total if a 5% minimum overlay was bet on. A $37.6k profit would have been recorded, at a rate of 11.9% ROI.

Very good figures indeed, but these are of course based on previous data, and choosing the minimum overlay after it has occurred, will produce a better result than betting live. But still these are very good results, and we will be looking at the over next.


Posted in Model, Sport Models | Leave a comment

College Basketball Totals Analysis

basketball1A lot of talk in the forum has been with regards to college basketball and the fact that the higher overlays this year have been losses, as opposed to last year when the higher overlays generally performed very well.

Is this just random variation or perhaps the model struggles at higher overlays due to injured players and the like? Well we thought we’d find out.

Shown below is the analysis of the College basketball since the start of the 2005/2006 season for betting overs and unders.

ALL
Prob#Bets#Won%Won$Bet$Profit%ROI
45.0%50.0%291344.8% $1,755.57 $156.868.9%
50.0%52.5%1648350.6% $11,313.28 $778.176.9%
52.5%55.0%106155352.1% $75,592.22 $3,215.07 4.3%
55.0%57.5%130966650.9% $131,974.51 $1,906.40 1.4%
57.5%60.0%64235855.8% $95,004.01 $9,778.26 10.3%
60.0%62.5%27114252.4% $52,796.98 $1,711.57 3.2%
62.5%65.0%1096963.3% $26,113.11 $6,222.92 23.8%
65.0%67.5%512752.9% $15,069.52 $1,230.48 8.2%
67.5%70.0%20945.0% $6,707.23 -$1,181.55 -17.6%
70.0%100.0%211047.6% $9,535.93 -$554.67-5.8%
3677193052.5% $425,862.36 $23,263.53 5.5%
Odds#Bets#Won%Won$Bet$Profit%ROI
1.501.757685.7% $1,069.66 $561.7852.5%
1.751.8011981.8% $1,477.92 $245.8816.6%
1.801.85593152.5% $7,585.87 -$689.62-9.1%
1.851.9019110756.0% $25,147.16 $1,130.81 4.5%
1.901.951941102252.7% $227,107.66 $13,561.47 6.0%
1.952.0088945250.8% $96,900.41 $1,870.84 1.9%
2.002.0532416851.9% $36,107.08 $2,647.40 7.3%
2.052.10965759.4% $10,924.59 $2,486.98 22.8%
2.102.151065652.8% $12,122.78 $2,008.61 16.6%
2.155.00532241.5% $7,419.22 -$560.64-7.6%
3677193052.5% $425,862.36 $23,263.53 5.5%
Overlay#Bets#Won%Won$Bet$Profit%ROI
0.0%7.5%119463152.8% $77,120.17 $3,135.54 4.1%
7.5%10.0%79838247.9% $72,374.74 -$3,884.83 -5.4%
10.0%12.5%58531553.8% $68,130.16 $5,236.22 7.7%
12.5%15.0%36921157.2% $52,136.69 $7,433.49 14.3%
15.0%17.5%26313451.0% $44,155.16 $1,233.40 2.8%
17.5%20.0%1719555.6% $33,109.03 $3,492.36 10.5%
20.0%22.5%1156153.0% $24,721.28 $1,854.80 7.5%
22.5%25.0%574070.2% $13,728.45 $5,629.60 41.0%
25.0%30.0%773950.6% $21,992.81 $348.181.6%
30.0%100.0%482245.8% $18,393.88 -$1,215.22 -6.6%
3677193052.5% $425,862.36 $23,263.53 5.5%
Av.Game Year#Bets#Won%Won$Bet$Profit%ROI
0217635.3% $2,217.06 -$743.50-33.5%
23512651.0% $7,736.31 $50.220.6%
3524814357.7% $37,311.13 $6,439.45 17.3%
57.530514748.2% $42,139.82 $1,011.08 2.4%
7.51043123153.6% $54,078.34 $3,070.19 5.7%
101584445353.7% $95,444.76 $7,169.38 7.5%
152080742652.8% $85,845.07 $4,531.85 5.3%
202560130350.4% $61,219.26 -$877.63-1.4%
253034418152.6% $36,126.01 $1,941.86 5.4%
301000291448.3% $3,744.59 $670.6317.9%
3677193052.5% $425,862.36 $23,263.53 5.5%
Expected Total#Bets#Won%Won$Bet$Profit%ROI
5010011436.4% $2,124.49 -$207.71-9.8%
10012037118850.7% $52,494.75 $2,120.18 4.0%
12012533218956.9% $39,706.76 $5,573.78 14.0%
12513045923250.5% $53,519.48 $374.310.7%
13013557730753.2% $63,379.49 $3,993.30 6.3%
13514057129852.2% $60,341.81 $3,446.57 5.7%
14014550526352.1% $56,916.36 $3,644.13 6.4%
14515037920453.8% $42,840.42 $1,604.92 3.7%
15015521912155.3% $22,875.44 $2,672.27 11.7%
155100025312449.0% $31,663.34 $41.780.1%
3677193052.5% $425,862.36 $23,263.53 5.5%
Total Line#Bets#Won%Won$Bet$Profit%ROI
501003133.3%$453.12-$95.31-21.0%
10012028013548.2% $35,059.80 -$600.89-1.7%
12012531617756.0% $35,694.55 $4,809.03 13.5%
12513050626151.6% $55,938.05 $1,481.86 2.6%
13013568236553.5% $75,791.91 $5,578.91 7.4%
13514060632553.6% $66,279.18 $7,459.18 11.3%
14014553227351.3% $61,753.34 -$80.23-0.1%
14515037119051.2% $44,532.89 $2,533.96 5.7%
15015520811856.7% $24,719.16 $2,587.90 10.5%
15510001738549.1% $25,640.35 -$410.91-1.6%
3677193052.5% $425,862.36 $23,263.53 5.5%

One can see good profits are made across all odds, and with the exception of probabilities greater than 67.5%. As far as overlays go, overlays less than 10% lost slightly, whilst overlays greater than 25% lost.

This adds to the theory that the highest of overlays are not profitable. This is a bit of a concern, as a good model should increase profit with increased overlay. Quite clearly there is something missing in the model, and the most likely answer is player injuries and/or players returning after being absent.

The 3rd last table, shows the average matches that both teams have played throughout the year and the profits that are seen. Clearly it shows that for the first 2 rounds, it is wise not to bet on any of the teams on the unders and overs, however, the sample size is only a mere 17 bets.

And the final two tables, look at the expected total as well as the total line. Interestingly when the expected and line is small or large, less profit is made.

So what does this mean? It means that one should be careful when betting on overlays greater than 25%. I don’t recommend not betting on overlays that are greater than 25%, such a decision is not really practical for many when searching for best odds. But the problem occurs when greater overlays result in greater bet sizes. So perhaps the best option might be to cap the overlay at 25%, so that one isn’t over betting on the higher overlays.

Either way, we will look at the analysis, separating by overs and unders next, and this might well provide even more interesting results.

Sportpunter’s free College Basketball predictions are shown here

Posted in Model, Sport Models | 1 Comment

Soccer minimum totals overlays based on League Level

We previously looked at betting h2h in soccer and its returns based on league popularity. This time we will look at totals betting using the same five groups of leagues that we used previously. Results pre group are shown below:

Group1Overlay#Bets#Won%Won$Bet$Profit%ROI
00.07542720047% $27,700.42 -$291.36-1%
0.0750.134016348% $30,566.84 $15.200%
0.10.12527712445% $32,219.92 -$266.23-1%
0.1250.151928444% $27,110.07 -$1,159.39 -4%
0.150.1751345440% $22,526.63 -$3,180.66 -14%
0.1750.2915055% $17,203.03 $2,310.45 13%
0.20.225683754% $14,697.33 $2,454.50 17%
0.2250.25512855% $12,096.57 $2,369.23 20%
0.250.3774761% $20,925.85 $5,892.19 28%
0.3100552444% $18,891.16 -$944.17-5%
TOTAL171281147% $223,937.82 $7,199.76 3.2%
Group2Overlay#Bets#Won%Won$Bet$Profit%ROI
00.07571834848% $45,745.87 $560.321%
0.0750.159930050% $53,660.59 $3,018.15 6%
0.10.12544520346% $50,743.54 -$50.400%
0.1250.1536716846% $51,158.29 -$254.340%
0.150.17527012948% $44,874.35 $1,323.17 3%
0.1750.221511051% $40,348.63 $4,054.60 10%
0.20.2251265846% $27,048.37 $203.131%
0.2250.25864653% $21,066.58 $3,506.14 17%
0.250.3925155% $25,176.64 $3,714.70 15%
0.3100764053% $25,825.44 $4,569.56 18%
TOTAL2994145349% $385,648.30 $20,645.03 5%
Group3Overlay#Bets#Won%Won$Bet$Profit%ROI
00.07551226953% $34,341.27 $2,657.12 8%
0.0750.138019150% $35,142.24 $923.913%
0.10.12531415750% $36,999.64 $1,690.36 5%
0.1250.1525211947% $35,736.14 -$247.22-1%
0.150.17523810544% $39,883.60 -$2,336.56 -6%
0.1750.21517449% $29,029.51 $1,378.82 5%
0.20.225965355% $19,897.77 $3,063.42 15%
0.2250.25714158% $16,755.73 $3,498.78 21%
0.250.3843542% $21,434.81 -$621.04-3%
0.3100914651% $31,191.06 $4,972.08 16%
TOTAL2189109050% $300,411.77 $14,979.67 5%
Group4Overlay#Bets#Won%Won$Bet$Profit%ROI
00.0751728047% $12,145.65 -$1,952.15 -16%
0.0750.11477350% $14,475.37 -$124.11-1%
0.10.1251255947% $14,854.52 -$790.82-5%
0.1250.15874552% $12,474.38 $733.546%
0.150.175684160% $11,139.96 $2,578.65 23%
0.1750.2563563% $10,283.77 $2,990.36 29%
0.20.225331958% $6,439.81 $1,427.89 22%
0.2250.25271141% $6,190.96 -$779.70-13%
0.250.3352263% $9,155.46 $2,896.74 32%
0.310017847% $5,599.23 $806.8214%
TOTAL76739351% $102,759.11 $7,787.22 8%
Group5Overlay#Bets#Won%Won$Bet$Profit%ROI
00.075462452% $3,905.12 -$115.81-3%
0.0750.1372362% $3,618.17 $748.2721%
0.10.125382361% $5,491.03 $469.749%
0.1250.15271141% $3,802.24 -$407.98-11%
0.150.17512542% $1,943.30 -$88.35-5%
0.1750.213969% $2,402.52 $1,022.62 43%
0.20.22513969% $3,018.51 $1,295.99 43%
0.2250.254375%$902.67$388.3943%
0.250.36117% $1,551.49 -$659.51-43%
0.31006467% $3,034.96 $641.3321%
TOTAL20211255% $29,670.01 $3,294.69 11%

soccer6For starters once again we have good profit in all the different groups which is great, and also once again the percent return seems to increase as the group size becomes less popular from 3% ROI in Group 1 up to 11% ROI in Group 5.
Looking within groups we can also find some interesting results. In Group 1, a loss was made betting totals with an overlay of 17.5% or less. A 3% ROI loss was made in this circumstance, however it is noted that when the overlay is above this figure, a 14.4% ROI profit has been made. Same sizes are relatively smallish here, with 342 bets with a 17.5% ROI minimum overlay for Group1, but analysis seems to suggest that a greater minimum overlay for totals bet in group1 might be advantageous.

This minimum overlay doesn’t seem to occur in Group2 with all areas producing great profits. Higher overlays recorded greater %ROI’s which is great to see. Similar results are shown in Group3.

Group4 has negative results for overlays less than 12.5% ROI, but considering the great results of neighbouring groups3 and 5, one could say that this is merely due to random variation. Just goes to show that even with hundreds of bets, random variation still plays a very large part. Group5 has limited data, but it would seem that all bets seem to be profitable across the overlays.

So the conclusion to be made here? I would say bet all groups at minimum 5% overlay, however increase that minimum to 17.5% or 20% for the most popular leagues that you think deserve to be in Group1.

As for expected profits. All are pretty consistent over the groups. Group1 has an expected ROI, or average overlay of 12.8%. Group2 has 12.7%, Group3 13.5%, Group4 13.0% and Group5 13.1%.

This is quite surprising that it is so low considering the large %ROI achieved in some of the groups. Put simply this means that the optimal Kelly fractional to bet with in each of these groups is as follows:

Group1 – 12.8 / 3.2 = 3.97

Group2 – 2.37

Group3 – 2.71

Group4 – 1.72

Group5 – 1.18

This in my opinion shows how strong the Sportpunter totals model actually is. Considering your bank balance, I don’t recommend on betting anywhere near a 1.18 Kelly fractional – this is very close to betting at full Kelly. A small sample size might have something to do with it, but the results are very promising indeed. I’m sure the optimal Kelly fraction would decrease for Gorup1 if a minimum overlay of 20% was implemented for the bets

Either way, I see no reason to not have a consistent Kelly fraction amongst all of the groups.

Posted in Model, Sport Models | 6 Comments

Super 14s free predictions and analysis

Super 14ssuper14s predictions have been happening on Sportpunter since 2003. We started off amazingly well, winning profits in the first three years and four of the first five years. In 2004 we recorded an amazing 50% return on investment which is stupidly huge. The last couple of years have seen small losses and because of this it is important to analyse why this is so.

Of course, Super14s is a very hard sport to model. With teams only playing 13 matches in a season, if you don’t get a grip early on, on exactly how the teams are going, then you can fall behind. Getting a good idea of how teams will start is so important, and we will look at how we have gone in this regard.

The following is an analysis of how we have gone on our bets going back to 2003:

Prob#Bets#Won%Won$Bet$Profit%ROI
00.1400%$57.34-$57.34-100.0%
0.10.227311% $1,188.12 $208.2217.5%
0.20.353713% $3,758.37 $105.782.8%
0.30.4702840% $7,166.30 $2,894.46 40.4%
0.40.5692841% $8,901.80 $297.213.3%
0.50.6622642% $10,604.51 $342.473.2%
0.60.7462248% $9,823.09 -$582.89-5.9%
0.70.8402768% $10,361.93 $504.554.9%
0.80.9201680% $6,459.85 $614.439.5%
0.9111100%$430.67$51.6812.0%
39215840% $58,751.95 $4,378.57 7.5%
Odds#Bets#Won%Won$Bet$Profit%ROI
11.5382771% $10,719.63 $62.390.6%
1.51.75422560% $8,520.28 $402.924.7%
1.752331958% $6,348.99 $918.5414.5%
22.5582238% $9,507.63 -$2,049.77 -21.6%
2.52.75311342% $3,983.47 $170.994.3%
2.753321238% $4,787.68 $475.569.9%
34532445% $6,033.09 $4,953.49 82.1%
46551120% $5,228.02 -$670.99-12.8%
61038411% $2,757.68 -$879.16-31.9%
101001218%$865.49$994.60114.9%
39215840% $58,751.95 $4,378.57 7.5%
Overlay#Bets#Won%Won$Bet$Profit%ROI
0.000.1904146% $9,447.22 -$418.00-4.4%
0.100.15703449% $11,250.69 -$387.73-3.4%
0.150.2562138% $7,214.51 -$523.06-7.3%
0.200.25371643% $5,432.87 $983.8018.1%
0.250.3271141% $4,922.78 $1,211.27 24.6%
0.300.4371335% $6,545.20 $462.607.1%
0.400.5261350% $4,493.68 $3,961.78 88.2%
0.500.621629% $3,431.66 $1,197.25 34.9%
0.600.81517% $3,529.49 -$2,685.88 -76.1%
0.80513215% $2,483.85 $576.5423.2%
39215840% $58,751.95 $4,378.57 7.5%
Month#Bets#Won%Won$Bet$Profit%ROI
2772938% $13,319.41 -$624.18-4.7%
31455538% $20,787.58 $2,191.50 10.5%
41084945% $16,481.35 $1,629.33 9.9%
5622540% $8,163.61 $1,181.92 14.5%
Total39215840% $58,751.95 $4,378.57 7.5%

As one can see from the above table, all probability sections seem to perform quite well. In regards to odds, betting at odds of 4 and above recorded a slight loss, but one must be quite cautious about this considering the massive gains made betting on teams whose odds are between 3 and 4.

As far as overlays goes, it is clear that betting on overlays less than 20% are not beneficial. A 5% ROI loss was made in the smaller overlays. Larger overlays show good profit, however a concern is the 3 wins only from 28 bets of the 60%+ overlays. Quite clearly, these bets are ones on big outsiders.

By month is also interesting, the first month, February has made a 4.7% ROI loss, whilst all other months have shown good profit.

What does this all mean? To me it means that early on the model takes a little while to get a grasp of the quality of each team. This is understandable, as with Super14s, the tournament only lasts 3 months and players play a lot of rugby outside this time. Hence teams can come back into the competition a lot different than what they were 9 months previously.

Either way, the analysis shown above shows that there is ample opportunity to make some nice money betting on the Super14s.

And best of all, the predictions are all free. Go here for all the free tips. The first round starts this weekend!

Posted in Model, Sport Models | Leave a comment

Soccer minimum overlays based on League Level

soccer5

Previously we talked about not quite getting as good 1×2 profits betting on the more popular and more professional leagues. We did manage to win evenly across the board betting totals which is a great result. However more analysis is obviously required in the head to head betting.

So based on the groups given previously, I decided to have a look at the results for minimum overlay per group. The results are shown below.

Group1Overlay#Bets#Won%Won$Bet$Profit%ROI
00.07536213136% $20,025.60 -$1,505.48 -8%
0.0750.12628733% $16,879.89 -$1,171.55 -7%
0.10.1541416039% $33,632.34 $4,830.59 14%
0.150.23279629% $29,896.26 -$1,583.59 -5%
0.20.33638423% $34,331.27 -$2,735.62 -8%
0.30.42154722% $23,853.78 -$588.40-2%
0.40.5872023% $10,847.67 $1,905.38 18%
0.50.751101917% $13,712.50 $531.874%
0.75120210% $2,210.05 $130.576%
110020525% $4,972.18 $2,626.52 53%
TOTAL218065130% $190,361.54 $2,440.29 1%
Group2Overlay#Bets#Won%Won$Bet$Profit%ROI
00.07555122140% $26,540.52 $1,808.68 7%
0.0750.150717535% $34,488.99 -$3,426.25 -10%
0.10.1576127636% $60,773.20 $1,773.69 3%
0.150.256618332% $57,773.94 -$3,205.87 -6%
0.20.368021331% $79,741.21 $4,806.14 6%
0.30.435710128% $48,845.36 $3,684.38 8%
0.40.51904021% $24,537.20 $655.883%
0.50.752064522% $30,295.73 $4,930.67 16%
0.751621016% $11,145.95 $103.311%
110029310% $6,268.86 -$1,803.84 -29%
TOTAL3909126732% $380,410.96 $9,326.79 2%
Group3Overlay#Bets#Won%Won$Bet$Profit%ROI
00.07538415440% $19,716.13 $513.563%
0.0750.132511234% $20,526.14 -$1,290.43 -6%
0.10.1557221938% $45,593.43 $4,727.70 10%
0.150.241013433% $36,638.91 $1,691.69 5%
0.20.354816330% $63,141.87 -$91.890%
0.30.43068327% $38,859.15 $3,976.34 10%
0.40.51673420% $20,385.67 -$167.40-1%
0.50.752424820% $34,355.20 $3,459.68 10%
0.751701217% $11,884.29 $936.368%
1100711115% $18,521.98 -$544.00-3%
TOTAL309597031% $309,622.77 $13,211.61 4%
Group4Overlay#Bets#Won%Won$Bet$Profit%ROI
00.0751647143% $10,573.62 $153.161%
0.0750.11316046% $12,342.20 $1,174.19 10%
0.10.151857339% $16,958.98 $1,820.18 11%
0.150.21886434% $19,984.33 $66.110%
0.20.31705633% $19,765.21 $1,864.14 9%
0.30.41293527% $18,563.02 -$1,007.34 -5%
0.40.5611525% $8,423.87 $620.887%
0.50.75802531% $11,366.80 $7,025.83 62%
0.75128829% $4,337.63 $3,926.09 91%
11008338% $2,222.97 $2,715.78 122%
TOTAL114441036% $124,538.63 $18,359.02 15%
Group5Overlay#Bets#Won%Won$Bet$Profit%ROI
00.075332061% $3,508.14 $875.7025%
0.0750.1412151% $4,909.99 $310.696%
0.10.15452147% $4,564.12 $674.8615%
0.150.2492245% $6,995.75 $928.3813%
0.20.3421229% $5,915.61 $366.466%
0.30.439718% $6,557.69 -$2,116.38 -32%
0.40.5261350% $5,617.73 $3,852.19 69%
0.50.7531929% $7,602.22 $845.4511%
0.75115533% $4,154.20 $2,367.06 57%
11007343% $2,749.91 $2,746.29 100%
TOTAL32813341% $52,575.36 $10,850.70 21%

The table above is quite interesting. It still shows the same pattern that more money is made on less favourable leagues, but also suggests that different minimum overlays should be used for different leagues.

In group1, a minimum overlay of 40% is optimal. All bets below this amount lost 1.7% ROI. For group 2, a minimum overlay of 20% is optimal, whilst group3 has a minimum overlay of 10% being the best option. The smaller leagues of group4 and group5 show 5%, which is the standard, as being the best minimum overlay.

So perhaps we should adjust for the professionalism and popularity of the league when betting on the head?

Also interesting to analyse is the optimal Kelly amount.

In total we have an expected ROI of 23.7%. This is basically the average of all the overlays. In reality however the record shows that we have only made 5.1% ROI. Hence the optimal Kelly fractional is 23.7 / 5.1 = 4.6, which is quite high.

But looking at different leagues we get different results. For Group1, the expected ROI is 21.4% with the actual win% being at 1.3%. This means an optimal Kelly fractional of 16.7

Group2 has an expected ROI% of 22.2% compared to an actual %ROI of 2.5% and an optimal Kelly fractional of 9.0

Group3has an expected ROI% of 26.6% compared to an actual %ROI of 4.3% and an optimal Kelly fractional of 6.2

Group4 has an expected ROI% of 23.8% compared to an actual %ROI of 14.7% and an optimal Kelly fractional of 1.6

Group5 has an expected ROI% of 29.6% compared to an actual %ROI of 20.6% and an optimal Kelly fractional of 1.4

So we have optimal kelly fractionals ranging from 16.7 down to 1.4 compared to the different leagues. I wouldn’t recommend betting anywhere near 1.4 kelly for Group5, however the 16.7, 9 and 6.3 kelly fractionals are all reasonable.

Considering the minimum overlay recommendations for Groups 1 to 3, we can work out the optimal kelly fractional given these minimum overlays for these groups.

For group 1 and minimum 40% overlay, our expected ROI increases up to 63.4% ROI. Our actual ROI was at 16.4%, which means our optimal kelly fractional to be 3.9

For group 2 and minimum 20% overlay, our expected ROI increases up to 39.1% ROI. Our actual ROI was at 6.2%, which means our optimal kelly fractional to be 6.3

For group 3 and minimum 10% overlay, our expected ROI increases up to 32.4% ROI. Our actual ROI was at 5.2%, which means our optimal kelly fractional to be 6.2

So we dont have to bet at high kelly fractionals to get good results. Note that for Group1, there is a limited number of matches that have overlays greater than 40% – only 237. So accross the board, it would seem that a kelly fractional of around 6 would be most ideal. One could change this based on the type of group, and of course based on the bank balance and one’s sense of risk.

If you dont understand any of the above, don’t stress, but a slight understanding will start you on the way to be a better gambler.

We’ll look into the above for totals next.

The soccer model at the moment is completely free. Check out the free predictions here.


Posted in Model, Sport Models | 1 Comment

Who was the most underrated and overrated AFL team in 2009?

afladelaideThe AFL season is fast approaching, and even this weekend the pre season cup will start. So just for a teaser for the start of the AFL season, we will look at what teams were the most underrated and overrated teams of 2009.

How will we decide? Well if were to make a bet on each team throughout the season to win $100, what teams would have made us the most and least profit? The answers are shown below:

Team$Bet$Profit%ROI
Adelaide $5,125.90 $741.3114.5%
Brisbane $5,154.55 $604.5911.7%
Collingwood $5,872.79 $417.617.1%
Geelong $17,981.51 $1,085.54 6.0%
St. Kilda $13,955.41 $169.491.2%
North Melbourne $1,716.69 -$12.48-0.7%
West Coast $2,250.36 -$79.34-3.5%
Sydney $2,278.08 -$123.07-5.4%
Essendon $2,121.13 -$118.86-5.6%
Carlton $5,261.66 -$331.64-6.3%
Western Bulldogs $8,571.29 -$597.34-7.0%
Melbourne$728.01-$82.51-11.3%
Port Adelaide $3,930.39 -$619.18-15.8%
Richmond $1,657.49 -$449.79-27.1%
Fremantle $1,542.91 -$450.76-29.2%
Hawthorn $4,201.41 -$1,355.44 -32.3%

Interestingly Adelaide are at the top of the table. Tipped by many to miss the eight, the crows shocked almost all by making the finals, but were only a goal or a few seconds away from playing in a prelim. Brisbane also performed greater than expected and finished in 6th position as did Collingwood who finished 4th. St. Kilda would have been cruising on top of the table above until they lost consecutive matches to Essendon and North Melbourne at odds of 1.14 and 1.08 late in the season. The premiers Geelong, made the most profit.

On the other side of the table, reigning premiers Hawthorn looked like anything but. Sportpunter tipped them to finish outside the eight despite winning the premiership the year before, and we collected big against the hawks. On average in 2009 the hawks had 10 premiership players missing – that’s half a side, and impossible for any team to make up. Port Adelaide played below expectations, and Fremantle and Richmond would have to be the two most overrated teams in the competition. Interestingly third placed Western Bulldogs is on the lower half of the above table, but that was largely due to their 1.07 home loss to the West Coast Eagles.

I will soon do a write up about what to expect in 2010 for AFL, but in the meantime, make sure you sign up to the Sportpunter AFL model. We made a massive 21% ROI last year, and the record over the years is second to none.

Posted in Blog, Gambling Blog | 7 Comments

Soccer model performance in relation to league level

soccer4On request, I decided to analyse how the soccer model has gone in the past 365 days with relation to the quality of the league. I have deicded to group the soccer leagues in terms of 5 groups, from 1 being the best most popular and more professional group, to 5 being the least popular and least professional.

Some of the leagues I will admit are in the wrong place, and there will always be debate about what leagues go in which groups, but for the meantime these will be them.

Group1:

england1
england2
france1
germany1
italy1
netherlands1
portugal1
scotland1
spain1

Group2:

austria1
belgium1
croatia1
czechia1
england3
england4
france2
germany2
greece1
ireland1
italy2
netherlands2
norway1
poland1
portugal2
scotland2
slovenia1
spain2
sweden1
switzerland1
turkey1

Group3:

argentina1
australia1
austria2
belgium2
czechia2
denmark1
england5
finland1
france3
greece2
iceland1
israel1
japan1
mexico1
norway2
poland2
russia1
scotland3
slovakia1
turkey2
usa1
wales1

Group4:

chile1
finland2
hungary1
latvia1
lithuania1
romania1
scotland4
sweden2
ukraine1
uruguay1

Group5:

ecuador1
estonia1
peru1
singapore1

And based on the above, here is how we have done in h2h betting over the past 365 days:

Grade#Bets#Wins%Wins$Bet$Profit%ROI
1190457530.2% $168,526.83 $2,729.20 1.6%
23620118632.8% $357,051.03 $10,794.94 3.0%
3294695132.3% $297,795.85 $20,900.42 7.0%
4112940736.0% $123,937.23 $18,421.95 14.9%
533113540.8% $53,637.42 $11,414.58 21.3%

What is pretty clear from the above, is that as the grade becomes worse off, the %ROI becomes greater and greater. Profits are found in all groups which is pleasing, but less so in the more professional grades, which is, where you are able to bet more as well.

This makes sense to me. Lower, less followed grades probably dont have a lot of information are not studies as much as the top grades. Furthermore, the discrepancy between the best player in the team and worst player in the team is greater for the higher leagues than the lower leagues. This means that should a teams best player be missing in the lower grades, it will not make as much difference as it would the better leagues.

But still, profits in all groups is really good to see. As far as totals betting goes, the following are the results:

Grade#Bets#Wins%Wins$Bet$Profit%ROI
190846050.7% $121,616.32 $8,117.31 6.7%
22645127848.3% $340,618.51 $11,060.87 3.2%
32366116349.2% $320,316.32 $16,189.48 5.1%
4116056448.6% $157,177.02 $9,784.38 6.2%
523612151.3% $33,747.91 $1,245.17 3.7%

Better results here, with the totals results being spread relatively even amongst all the leagues. This is great news, and it tells me that the soccer totals model is basically spot on. The great records over the past few weeks has helped greatly.

For all the free soccer predictions, click here.

Posted in Model, Sport Models | 1 Comment

Same country opponents in tennis. Who to bet on?

With Jjuanmonacouan Monaco just defeating Juan Ignacio Chela in Santiago 6-3 7-5, there has been a bit of talk in the past about what effect a tennis match has when both players are from the same country.

Both Monaco and Chela are from Argentina, and no doubt hold a good comradery. So what does this mean on the tennis betting circut? Many believe that this means that the match is more likely to play pretty evenly, and if anything therefore, a bet against the favourite holds some value.

So lets do the stats hey? How would we have gone betting to win $100 on the favourite and the underdog or all tennis matches were both players are from the same county. Ther results are interesting.

As it turns out, according to my dataset, since 2005, this has occured 1074 times where I have odds for both players.

So for the favourites, we would have bet in total $416,824.07 for a handy profit of $4,920.87. That is a 1.2% ROI. For the underdog we would have bet $54,692.30 for a massive $24,440.35 loss. Thats a  44.7% ROI negative swing.

Even if we look at matches where the favourite is at odds of 1.5 or greater (thus reducing any favourite/longshot bias), we achieve a 2.9% ROI profit betting on the favourite and a 31.7% ROI loss betting on the underdog.

So there it is. I’ve debunked that myth. When two tennis players are of the same country and play each other, you are far better off betting the favourite than the underdog.

Sportpunters tennis predictions are available here

Posted in Blog, Gambling Blog | 2 Comments

New Soccer leagues predictions set to start

soccerballThere’s plenty of new soccer leagues set to start within the next month. The following are some of the leagues that will shortly get underway:

  • Chile Primera Division
  • Ecuador Primera A
  • Estonia Meistriliiga
  • Finland Veikkausliiga
  • Japan J-League
  • Norway Eliteserien
  • Norway 1. Divisjon
  • Peru Primera Division
  • Russia Premier League
  • Singapore S-League
  • Sweden Allsvenskan
  • Sweden Superettan
  • USA Major Soccer League

Also shortly to come are the following:

  • Iceland Urvalsdeild
  • Finland Ykkonen
  • Lithuania A Lyga
  • Ireland Premier League
  • Latvia Virsliga
  • Brazil Serie A

As well as the other 48 leagues that we are giving free predictions for already! And if anyone had checked the results for the soccer of late….if you had bet into the scottish premier league, you would have some quite well. Kilmarnock defeated Celtic at odds of 9.60!

In fact since live betting has gone underway, we’ve done amazingly well. Head to head (or 1×2) betting has netting 6.5% ROI from 3987 bets. All free predictions too.

Check out the free soccer predictions here.

Posted in Model, Sport Models | Leave a comment

Sportpunter Australian Open tennis Meet Up

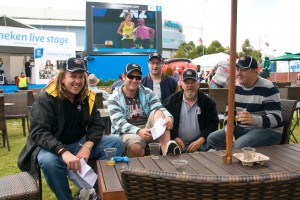
A few pictures showing here what a great day it was:

SP Meetup

SP Group

Sp Far

Related Posts with Thumbnails
Posted in Blog, Gambling Blog | 2 Comments