Melbourne Storm Salary Cap Breach Predictions

melbournestormMelbourne Storm’s season has been rocked by salary cap breach scandals that have seen them lose not only their current 8 premiership points that they had received from 4 victories this year, but also two of their premierships.

Before news broke of Storms loss of 2010’s current premiership points, some smart gamblers backed the Storm to win the wooden spoon at odds of 250 to 1.

So it’s a guaranteed situation that Melbourne storm will now finish bottom of the ladder, when they previously were very favoured to win the premiership and unbackable to miss the finals.

This means a couple of things, that other teams now will have an increased probability of making the finals and indeed, winning the premiership. So how much difference will it mean to other teams? We will have a look at that now.

Based on our computer model, Melbourne Storm were a 21% chance to win the premiership and a 92% chance to make the finals. All that is gone now, and other clubs will share in those probabilities.

For the premiership, interestingly, only the top ranked teams seem to have increased in premiership chances. St. George increase from 19.6% chance to win the premiership up to 22.7% chance, an increase of 3.1%. Similarly, Penrith increase from a 6.7% chance to a 10% chance, and Manly increase from a 15.6% chance to 17.8% chance. Sydney roosters and Parramatta also increase, but our computer simulation sees most other clubs as increasing only marginally.

The probability of players making the finals is interesting. All teams increase from as little as 1% for St. George (94.2% to 95.4%) to as much as 6.5% for the Gold Coast (62.5% up to 69%).

Either way, what is clear is that other teams now have an increased chance of making the finals and winning the premiership.

As for Melbourne, well, it’s curtains for now.

Click here for the NRL predictions and mathematical model.

Posted in Blog, Gambling Blog | Leave a comment

American clay court bias in tennis

claycourtClay season has arrived in the tennis world and don’t the Europeans and South Americans love it. The British, Americans and Australians hate the red top, so much so that in Australia for example, the French Open is the only grand slam that isn’t televised. The Americans are getting into the clay court a little more now, they even host their own tournaments on clay from time to time, but even still, good players on Hard court are almost always overrated on the red top.


People just believe that Andy Roddick and other great American players will be just as good on clay, but quite often we see such great serving talented players losing to otherwise unknown Spaniards and Frenchmen.

So just to prove the above point, here is a simple example. I’ve managed to source all the matches that Top 500 ranked Americans have played non Americans on clay. How would we have gone had we simply backed the American to win $100 or backed his opposition.

When backing the American to win $100 we would have lost a total of $1928 from a turnover of $38,600. So a 5% ROI loss there, which sounds pretty standard.

But when backing the non-American to defeat the American on clay for $100, we made a profit of $1464 from $104,600 turnover. That’s a profit of 1.4% ROI.

It’s not huge, but it shows that the bias is there. In fact, if we look at all the clay tournaments that are not played in America then the result is even more exaggerated.

Backing Americans to defeat non Americans away from home on clay, resulted in a loss of $2,143 from $25,260 turnover. That’s an 8.5% ROI loss. Whilst backing against the American to win $100 would have profited $1,419 from $94,000 or 1.5% ROI.

So the bias is there. People just cant comprehend that such a great American, Aussie or Brit can really be so terrible on clay.

It’s a completely different game.

Posted in Blog, Gambling Blog | 2 Comments

Supercoach / Dream Team AFL Fantasy Footy Steals and Bargain Players Round 2

supercoach

Supercoach and Dream Team for AFL football is a big passion of mine. So much so that I’m involved in several leagues that total an entry fee of over $1000. It’s high stakes fantasy and I feel as though I have an edge over some of my fellow competitors.

So from time to time, I will be giving out who I believe are big bargains and steals from round to round. Players who will increase in value and who you should pick up. And here they are listed below by position for Round 2:

Defenders

Nick Malceski, Syd (SC: $273.5k, DT: $242.8):

Had a shocking run with injury in his last two years with the swans, but looks to be back to his 2007 form where he averaged 21 possessions a game. His 25 disposals on the weekend against reigning minor premiers St. Kilda shows me that he’s back to his best.

Tadgh Kennelly, Syd (SC: $320.7k, DT: $204.7k):

Better value on dream team here, but fellow Sydneysider or Irishman Kennelly missed all of last year to be premiers for his Gaelic football team. He comes back here majorly underpriced, and 28 possessions in round 1 shows that he will only increase in value

Others: Alex Silvagnia (FRE), Matt Maguire (BRL), Beau Waters (WCE), Rick Ladson (HAW)

Midfielders

Michael Barlow, Fre (SC: $111.4k, DT: $105.8k):

If you haven’t got him in your side, then get him in now. He was prolific during the pre season and topped it up with a 33 possession 2 goal game on the weekend. He will go up massively.

Ryan Bastinac, Nth (SC: $94.2k, DT: $89.5k)

A very nice 23 disposals in the opening round, following up a very good preseason. The young midfield of the kangaroos are very impressive, it’s a pity of their lack of height and power and front and down back to match.

Others: Luke Shuey (WCE), Mitchell Banner (PTA), Todd Banfield (BRL), Ben Howlett (ESS)

Rucks

Mark Seaby, Syd (SC: $287.9k, DT: $226.7k)

With Jolly leaving the swans, Seaby now becomes the no. 1 ruckman for Sydney. This is massive for any fantasy footy follower, and his points in round 1 – 82 in both SC and DT) testify that he is good value. He should only go up in price.

Robert Warnock, CAR (SC: $132.2k, DT: $101.8l):

More value in dream team  where he scored 85 points compared to 47 in supercoach. Even though, as second named ruckman for Carlton he will go up and up in value sitting nicely on your bench.

Others: Jackson Trengove (PTA), Brad Ottens (GEE)

Forwards:

Carl Peterson, Haw (SC: $100.2k, DT: $94.5k)

Stared in his first game for the hawks with 17 possessions and a goal. Ok sure it was against lowly Melbourne, but Peterson only played 57% of the game on the field. A little bit more and he should gain more points. But keep in mind, the hawks have to make way for Buddy and Bateman this week with Burgoyne lurking. Someone will have to make way

Eddie Betts, CAR (SC: $399.1k, DT: $274.3k)

Had a cracker of a pre season, and with no Judd for a while should rack up some more points. Betts has increased his average possessions every year since 2005, so signs are there that this could be his breakout year. 136/110 points last week showed us that he’s almost there.

Others: Patrick Dangerfield (ADE), Cameron Hitchcock (PTA), Chris Yarren (CAR), Hayden Ballantyne (FRE)

Posted in News, Sport News | 14 Comments

AFL line betting

afl4Previously we looked at how the Sportpunter AFL model had gone betting head to head. In this article we will look a little more in depth about how it goes betting on the line or with a handicap.

Traditionally, unlike Americans, Australians had always bet on any sport on the head. It makes perfect sense too; punters want to bet on whom they think is going to win as opposed to who is going to win by a certain margin. But more recently line betting has become more in vogue. This is because many of the head to head betting matchups are already almost over before they begin, with two many one sided matches making the betting uninteresting.

So line betting has made its way into Australian betting culture, and there are other advantages with it as well. Returns can be less varied as most odds are set to around 1.85 to 2.00, so wide fluctuations are less likely to occur. AFL is primed for line betting because the distribution of points throughout a game is relatively normally distributed.

Since 2005, we have been recording all the line bet odds, which isn’t as long as head to head betting, of which we had a lot more years of odds for. Throughout this time, head to head betting had made $5,330.07 profit at 5.3% ROI, whilst betting on the handicap has made twice as much: $10,716 profit for 8.2% ROI.  Many would say that this is a great sign that handicap betting is the way to go as not only is it more profitable but also more consistent.

So let’s have a look at how well the model had gone on line betting. The total results below differ slightly to that above as some matches in the database were added to the results post match, but are for obvious reasons not included in the betting history, but included in the analysis. As shown below, results have been very good. Not much can be talked about with regards to probabilities and odds with the exception that probabilities of over 75% didn’t do too well. Similarly, and interestingly, overlays greater than 50% lost. Sure there were only 8 bets, but this is strange. It may be more interesting to look at the actual lines to see if we can find a pattern that could possibly explain this.

Prob#Bet#Won%WonMet$Profit%ROI
0%50%22100%$129.90$172.76133%
50%55%713144%$5,017.53-$360.73-7%
55%60%27015357%$33,818.65$3,761.8511%
60%65%1628854%$36,391.36$2,502.297%
65%70%985657%$30,979.23$3,487.3911%
70%75%342265%$14,184.04$3,705.8726%
75%80%10440%$5,272.47-$1,301.67-25%
80%85%100%$618.82-$618.82-100%
85%90%11100%$751.02$702.2094%
90%100%00$0.00$0.00
64935755% $127,163.02 $12,051.14 9.5%
Odds#Bet#Won%Won$Bet$Profit%ROI
$1.00$1.5000$0.00$0.00
$1.50$1.604250%$594.53-$195.72-33%
$1.60$1.7000$0.00$0.00
$1.70$1.802150%$232.50$31.3914%
$1.80$1.90322166%$6,630.37$2,356.7436%
$1.90$1.9526913651%$54,062.14$94.710%
$1.95$2.0028316659%$54,165.85$8,925.6316%
$2.00$2.05381745%$7,963.90-$514.06-6%
$2.05$2.1014964%$2,555.63$935.0637%
$2.10$2.203133%$482.51-$208.62-43%
$2.20$3.0044100%$475.59$626.01132%
$3.00$25.0000$0.00$0.00
64935755% $127,163.02 $12,051.14 9.5%
Overlay#Bet#Won%Won$Bet$Profit%ROI
05%00$0.00$0.00
5%10%1587749%$12,646.35-$429.70-3%
10%15%1428459%$18,607.32$2,701.4715%
15%20%1095651%$19,972.47-$128.30-1%
20%25%774761%$18,336.17$3,357.5318%
25%30%694058%$20,112.40$2,708.4613%
30%35%442352%$14,743.46$377.173%
35%40%191368%$7,565.23$2,515.4133%
40%50%231565%$10,530.45$3,080.3029%
50%1000%8225%$4,649.17-$2,131.21-46%
64935755% $127,163.02 $12,051.14 9.5%

Shown below is the home team handicap for betting on the home team and the away team. Home team betting has done very well, and those in the know will know that home ground advantage is much underrated in AFL, so there are no surprises here.

HomeLine HomeBet #Bet #Won %Won $Bet $Profit %ROI
-100 -40 7 6 86% $1,942.42 $657.91 34%
-40 -30 12 7 58% $2,558.59 $628.72 25%
-30 -20 35 21 60% $5,707.52 $1,131.01 20%
-20 -10 45 28 62% $7,352.95 $740.25 10%
-10 0 31 18 58% $5,677.68 $1,290.97 23%
0 10 79 45 57% $16,959.93 $1,002.09 6%
10 20 81 49 60% $17,789.61 $3,140.29 18%
20 30 33 16 48% $6,442.24 -$236.48 -4%
30 40 22 12 55% $5,750.67 $766.11 13%
40 100 7 5 71% $1,622.39 $367.05 23%
TOTAL 352 207 59% $ 71,803.99 $ 9,487.92 13.2%
HomeLine AwayBet #Bet #Won %Won $Bet $Profit %ROI
-100 -40 22 13 59% $4,958.99 $539.47 11%
-40 -30 33 15 45% $6,617.77 $609.86 9%
-30 -20 65 33 51% $12,639.46 $439.46 3%
-20 -10 81 46 57% $15,969.43 $3,221.85 20%
-10 0 32 18 56% $5,799.58 $84.68 1%
0 10 36 14 39% $5,291.81 -$1,217.50 -23%
10 20 18 7 39% $2,788.85 -$879.16 -32%
20 30 8 4 50% $953.99 $103.71 11%
30 40 2 0 0% $339.15 -$339.15 -100%
40 100 0 0 $0.00 $0.00
TOTAL 297 150 51% $ 55,359.04 $ 2,563.21 4.6%

What is interesting however is that the model has failed to make a profit when betting on the line on the away team when they are favourite. In other words, when the line is zero or lower, 64 bets have been made for a loss of 24.9% ROI. This is interesting, and although the sample size is small, could well once again have something to do with the fact of the biased home ground advantage in the sport.

If this pattern continues to exist, then there could be a case for not betting on the line for teams that are favourites when away. Using this information could well enhance your betting profits even greater than the %ROI as shown above.

Either way, it goes to show that betting on AFL is a seriously profitable sport to bet on.

Sportpunter are getting subscriptions for their AFL Model now. Click here to register.

Posted in Model, Sport Models | Leave a comment

Sportpunter’s AFL Model Analysis

The AFL season is set to start again this Thursday and with my personal favourite model, we will be predicting from day 1. The tigers play Carlton in the traditional first up game, and we hope (or maybe we don’t) that it will a little closer game. IT may well be the year of the tiger, but any resemblance to Richmond is surely coincidental. Many people have put their stamp on the bulldogs to bark, and as punters we do indeed hope that the dogs – in another form – will.

But first up we will have a look at how the model has gone betting on the head to head, and determine exactly where the profits and losses can be further analysed.

Shown below is the analysis of Sportpunter’s AFL model from day 1, with exceptional results shown.

Prob#Bet#Won%Won$Bet$Profit%ROI
0%10%400%$61.88-$61.88-100%
10%20%52612%$2,258.55$904.3340%
20%30%1183126%$8,023.86$2,735.9434%
30%40%1785631%$17,272.72$2,638.2715%
40%50%1858043%$23,816.13$4,274.2818%
50%60%25212951%$42,091.95$5,065.0912%
60%70%22712354%$47,615.25-$953.68-2%
70%80%20414672%$57,468.28$10,713.4619%
80%90%12410282%$48,764.66$6,983.5714%
90%100%211990%$11,902.55$421.144%
136569251% $259,275.82 $32,720.52 12.6%
Odds#Bet#Won%Won$Bet$Profit%ROI
$1.00$1.1022100%$1,220.16$103.298%
$1.10$1.25373286%$14,854.81$1,007.497%
$1.25$1.40756485%$23,928.02$3,101.6913%
$1.40$1.6015210972%$43,207.66$3,884.329%
$1.60$1.8017111366%$40,434.92$6,804.8617%
$1.80$2.001407755%$28,007.16$271.811%
$2.00$2.201186353%$21,043.38$2,062.6510%
$2.20$2.401044745%$19,790.44-$923.68-5%
$2.40$2.751045048%$16,005.37$4,799.5730%
$2.75$3.501746537%$22,657.96$5,093.4122%
$3.50$5.001594730%$17,999.29$3,133.4917%
$5.00$25.001292318%$10,126.67$3,381.6233%
136569251% $259,275.82 $32,720.52 12.6%
Overlay#Bet#Won%Won$Bet$Profit%ROI
05%00$0.00$0.00
5%10%34820559%$45,453.07$2,679.936%
10%15%25615059%$45,959.32$5,210.7411%
15%20%18210256%$35,083.36$5,640.8016%
20%25%1205445%$22,708.65$2,634.7012%
25%30%1255544%$29,019.59$919.403%
30%35%843036%$19,482.12-$1,364.67-7%
35%40%582543%$14,569.14$2,230.7515%
40%50%703043%$17,617.30$4,219.3124%
50%1000%1224134%$29,383.28$10,549.5736%
136569251% $259,275.82 $32,720.52 12.6%

afl2Profits are generally recorded throughout all probabilities and all odds, which is great too see. And just like any good model, higher overlays result in higher profits, with a return of 27.6% ROI from 250 bets for overlays greater than 35%.

It seems therefore that the model is right on the market with regards to head to head betting. But has the model done better betting on the line? We will look at that next.

Posted in Model, Sport Models | 7 Comments

Sportsbet $100 NRL Money Back

nrl3NRL Season is set to start this weekend, and as per normal, Sportsbet are coming to the rescue with great offers.

If you bet with them up to $100 on any head to head matches, then for the first bet that you place, if you team is up at half time but loses, then you get your money back. You can bet $100 on all 8 games and receive up to $800 back in free bets.

That easy.

Take for example the first match, Brisbane vs North Queensland. You can back Brisbane at 1.85 to win, which when normalised equates to a 51.5% chance for them to win. Similarly, with the half time full time markets, the odds for Queensland to defeat North Queensland yet still be down at half time is 6.75, which equates to a probability of 13.3%.

So given that, there is a real edge here, most likely betting on any team for $100.

It’s not a big gain, but if you aren’t a member of sportsbet, then if you sign up with the link below then you are also legible for another $100 free bet.

I’d say some of the bookmakers will have offers like this on the cards coming up to the start of the NRL and AFL seasons, so keep your eyes peeled.

Once you sign up look for the “Footy Fightback” link on the right hand side

Posted in News, Sport News | 1 Comment

Sportpunter’s NRL Model Analysis

Previously we looked at how the big outsiders have done well in NRL since 2002. Simply betting on all teams where the odds are greater then 4.00 would have netted a profit in excess of 19% ROI. But when does this occur? On home teams or away teams?

Shown below is a breakdown of how home and away teams have gone for underdogs (Odds greater or equal to 2) and for odds greater than 4.00

#Bets#Wins%Wins$Bet$Profit%ROI
Home Underdogs47519741.5% $17,912.18 $1,537.82 8.6%
Away Underdogs97532333.1% $32,339.72 -$439.72-1.4%
TOTAL145052035.9% $50,251.90 $1,098.10 2.2%
#Bets#Wins%Wins$Bet$Profit%ROI
Home Odds >=4591220.3% $1,178.51 -$28.51-2.4%
Away Odds >=42335624.0% $4,430.80 $1,119.20 25.3%
TOTAL2926823.3% $5,609.31 $1,090.69 19.4%

As you can see, simply betting on the home team when they are the underdog has netted a very nice 8.6% ROI from nearly 500 bets. Away underdogs has lost slightly. But interestingly, home teams with odds greater than 4.00 have lost slightly whilst the away team has gained. Of course, there are only 59 times when the home team has odds in excess of 4.00, as it is obviously a reasonably rare occasion.

Shown below is how the Sportpunter NRL model has gone since 2002.

Prob#Bets#Wins%Wins$Bet$Profit%ROI
00.28833.4%$867.49$332.3638.3%
0.20.32332510.7% $8,921.06 $1,265.24 14.2%
0.30.44656213.3% $24,096.96 $8,563.68 35.5%
0.40.573112917.6% $45,279.56 $9,156.24 20.2%
0.50.67339613.1% $42,324.67 -$2,906.11 -6.9%
0.60.74655912.7% $26,959.13 -$2,611.70 -9.7%
0.70.82333314.2% $14,388.42 $3,092.17 21.5%
0.81881213.6% $9,053.09 -$1,025.04 -11.3%
TOTAL303641913.8% $171,890.39 $15,866.85 9.2%
Odds#Bets#Wins%Wins$Bet$Profit%ROI
11.213932.2% $1,786.28 $272.2415.2%
1.21.4338103.0% $4,330.93 -$161.75-3.7%
1.41.6483224.6% $7,769.03 -$394.46-5.1%
1.61.8332288.4% $11,428.89 -$3,502.23 -30.6%
1.822944615.6% $14,792.83 $56.300.4%
22.54829619.9% $35,617.22 $1,444.35 4.1%
2.533859825.5% $38,644.51 $2,392.00 6.2%
350058311619.9% $57,520.70 $15,760.39 27.4%
TOTAL303641913.8% $171,890.39 $15,866.85 9.2%
Overlay#Bets#Wins%Wins$Bet$Profit%ROI
00.11958141.5% $16,841.12 -$874.69-5.2%
0.10.231813743.1% $38,296.59 $141.690.4%
0.20.32157534.9% $32,667.91 -$2,195.41 -6.7%
0.30.41244233.9% $22,999.75 -$536.12-2.3%
0.40.5853136.5% $17,724.55 $2,416.76 13.6%
0.50.6581729.3% $13,427.45 $0.530.0%
0.61682232.4% $17,256.92 $6,032.28 35.0%
1500431432.6% $12,676.09 $10,881.80 85.8%
TOTAL110641937.9% $171,890.39 $15,866.85 9.2%

nrl2As for how our model has gone, it is no surprise that it has done exceptionally well with the bigger odds. Shown below is how it has gone since 2002. Probabilities under 50% have made 24% ROI from 1517 bets. Betting at odds of 3.00 or more has made an incredible 27.4% ROI. Overlays of 40% or more have made 31% ROI from 254 bets.

The bias in the NRL is simply incredible. Simply by changing the way you bet, the possibilities are endless for NRL given the massive bias and a very strong model. Of course there might not be overlays on all outsiders, and the model shows that instead of making 19% ROI over the big overlays and odds, the model makes a lot more profit, and is independent of the bias, which in itself is a very important thing. In other words, if the market adjusts, the model will, and should still do well.

To sign up for the 2010 NRL Model, click here.

Posted in Model, Sport Models | 1 Comment

Backing the underdogs in the NRL

nrl1The NRL season is about to start this Friday. It’s looking to be a great season with Parramatta slight bookie favourites over last years premiership team Melbourne Storm. Sportpunter’s NRL model has done exceptionally well over the years, making over 10% ROI since 2002 on 900 bets.

The next few days we will be giving you all the analysis about the NRL model with the anticipation of the new season about to start. But to start off with, here is some amazing statistics about how one would have gone blind betting teams since 2003.  Blind betting basically means that we will back each team no matter what to win $100. How would we have gone in certain circumstances? The results are shown below.

#Bets#Wins%Wins$Bet$Profit%ROI
Home151888258.1% $89,491.49 -$1,141.49 -1.3%
Away151863641.9% $66,913.50 -$3,463.50 -5.2%
#Bets#Wins%Wins$Bet$Profit%ROI
Hosting Interstate89253059.4% $53,674.46 -$524.46-1.0%
No Interstate123661850.0% $63,654.07 -$1,854.07 -2.9%
Travelling Interstate89236240.6% $38,253.69 -$2,203.69 -5.8%

The first table, as shown above looks at betting home teams or away teams. A 1.3% loss was made blind betting the home team, whilst a 5.2% loss was made blind betting the away team. Hence, the home ground advantage is probably a little underrated by the bookmakers and general public.

This is also shown in the results for when hosting a team travelling interstate or betting on a team that is travelling interstate. A greater profit, or perhaps I should say, a smaller loss, was made for the host team to a travelling team.

Interesting statistics, but not all that useful. What is useful is the statistics below which look at how we would have gone blind betting teams at certain odds.

Odds#Bets#Wins%Wins$Bet$Profit%ROI
11.213911280.6% $12,322.31 -$1,022.31 -8.3%
1.21.433824371.9% $26,146.71 -$1,646.71 -6.3%
1.41.648331164.4% $32,352.89 -$902.89-2.8%
1.61.833217953.9% $19,775.25 -$1,875.25 -9.5%
1.8229415352.0% $15,555.93 -$255.93-1.6%
22.548222646.9% $21,781.14 $768.863.5%
2.5338513936.1% $14,156.33 -$556.33-3.9%
350058315526.6% $14,314.43 $885.576.2%
TOTAL3036151850.0% $156,404.98 -$4,604.98 -2.9%
Odds#Bets#Wins%Wins$Bet$Profit%ROI
22.222311451.1% $10,715.58 $684.426.4%
2.22.41707946.5% $7,410.70 $439.305.9%
2.42.72508734.8% $9,879.46 -$1,229.46 -12.4%
2.732248537.9% $7,931.72 $318.284.0%
33.51845731.0% $5,789.53 -$189.53-3.3%
3.541073028.0% $2,915.59 -$15.59-0.5%
451353425.2% $3,074.10 $325.9010.6%
55001573421.7% $2,535.22 $764.7830.2%
TOTAL145052035.9% $50,251.90 $1,098.10 2.2%

Amazingly as shown above a profit was made betting all underdogs. That is blind betting all teams with odds of 2.00 or more, made a profit of 2.2% ROI. This is quite substantial, and the second of the two tables above looks at this race a little more closely.

Betting on teams with odds of 2.00 to 4.00 basically broke even, which obviously means that betting on teams with odds of greater than 4.00 has been amazingly successful. In fact, if one had bet every large underdog with odds of 4.00 or more, you would have made a profit of 19.4% ROI from 292 bets. On average that’s 36 bets per year.

The bias in the odds in massive. And we will be looking at certain circumstances where this might well be even more highlighted. What happens about big outsiders when home teams or when the opponent is travelling interstate. We will look at this in the next article, as well as an indepth analysis of Sportpunter’s NRL Model.

To sign up to the Sportpunter’s NRL model in 2010 click here.

Posted in Model, Sport Models | 3 Comments

Davis cup bias in home/away players

daviscupWith Davis Cup coming this weekend, I thought it was a good opportunity to find out how well the model goes. Many people would say that the Davis cup is a completely different game compared to normal tournaments, and if you have been to several countries which host it, I’m pretty sure that you will agree. Although this is the federation cup – which is the female equivalent to the Davis Cup – take a look at this clip which shows Maria Sharapova being heckled in Israel.

Ok, this is extremes, but the Davis Cup isn’t far behind as far as crowd fanaticism goes. Surely the home ground advantage is worth more in the Davis Cup than it is on any normal match. So how have we gone in the past blind betting as well as model betting on the home and away players?

I have data for only 168 matches, so not a lot should be read into it, but the finding are quite interesting. The home player averaged odds of 1.53 whilst the away player averaged odds of 2.72. Betting to win $100 on the home player means than $92k was bet for a profit of $1.6k for a 1.7% ROI. Whilst betting on away players $23k was bet for a profit of $319 or 1.4%. So, despite a lot more being bet on home players, largely due to very short odds, both home and away bets seem to be doing pretty good.

As far as the model goes. 63 bets were made for a 5.6% ROI betting on the home players, whilst 1.0% was made betting the away players over 23 bets. A lot less bets on the away players, but at least it shows that the model is on song at getting the home court advantage correct when it comes to Davis cup betting.

For all the tennis predictions, click here.

Posted in Model, Sport Models | Leave a comment

Betting short favourites in women’s tennis over the last 6 years

wtatennisEveryone knows that there is a favourite long shot bias in most sports. And despite this, many are very afraid to bet big on small priced favourites because of fears of losing way too much money. Money fluctuations are something that a gambler has to take his emotions out of. But is there value in betting the very short priced favourites?
Well we have looked at the women’s tennis – which is rife with short priced favourites – and seen how we would have gone betting on every female to win $100 based on their odds.

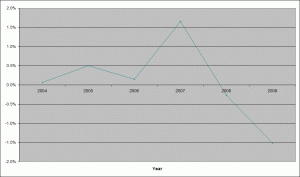
Shown below is a graph of how we would have gone each year betting on all females at odds of 1.25 and below and their corresponding %ROI values.

tennisfavcheck_29477_image001

Note on the above graph, throughout 2004 to 2007, a positive %ROI was achieved. Simply by backing every short priced favourite irrespective of the match. In 2008 a small 0.25% loss was achieved, whilst in 2009 a loss of 1.5% was made. Overall a 0.1% ROI was made since 2004.

So is the last couple of years simply random variation or perhaps the market has got more efficient? Either way, betting favourites, even without a mathematically advanced model that would give you the edge, is advantageous.

Related Posts with Thumbnails
Posted in Blog, Gambling Blog | 3 Comments