ATP Injury analysis
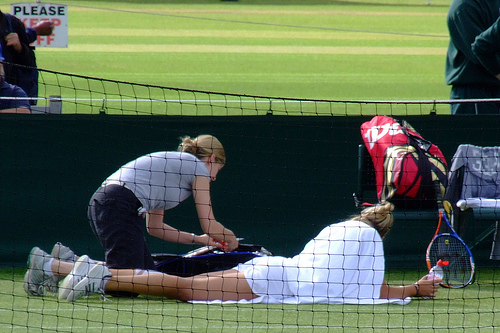 In previous articles we have looked at how well the new upgraded ATP model has done against certain probabilties and overlays. This analysis can be found linked on the right hand side of this page: http://www.sportpunter.com/sports/tennis/
However another interesting piece of information is how well the model goes based on our injury ratings. Sportpunter’s tennis model has four injury ratings and they are as follows
SurfaceNoPlay – Player has not played on this particular surface in last 2 months
LowPlay – Player has not won a match (or played) in last 2 months
Retire – Player has recorded at least 2 retirements or withdrawals in last 2 months
LossRetire – Player has not won a match since last retirement or withdrawal
Based on suggested bets from back to 2005, we can see how the model goes when betting on games where one of the above scenarios occur.
Shown below are the results of the ATP model for betting on players with the above scanerios (1), against a player with the above scenarios (-1) or when both players have, or do not have, the injury conditions.
The findings are quite substantial. Betting on a player who has not played on the particular surface recently resulted in an 8.1% loss from 310 bets, whilst a 9% ROI gain was made when the suggested bet was the other way around.
Similarly, when betting on a player who has not won or played a match recently, a 16.8% ROI loss was made, as compared to a 9% ROI gain the other way around.
There was little difference in the variables Retire and LossRetire for both betting for or against the injured player.
So what does this mean? Well, all these variables are in the model, and hence the model has accurately calculated the value of each one. However there still seems to be a bias there.
My conclusion is that the odds are biased in that they do not much enough for when a player has not played for a certain amount of time, or are “first up” in the last 2 months on a particular surface.
SurfaceNoPlay #Bets #Won %Won $Bet $Profit %ROI
1 310 134 43.2% $58,571.28 -$4,720.81 -8.1%
0 9014 3791 42.1% $1,387,954.09 $73,440.46 5.3%
-1 544 252 46.3% $119,623.03 $10,773.26 9.0%
TOTAL 9868 4177 42.3% $1,566,148.40 $79,492.91 5.1%
LowPlay #Bets #Won %Won $Bet $Profit %ROI
1 205 69 33.7% $37,172.96 -$6,232.67 -16.8%
0 9243 3849 41.6% $1,408,208.11 $74,917.63 5.3%
-1 420 259 61.7% $120,767.33 $10,807.95 8.9%
TOTAL 9868 4177 42.3% $1,566,148.40 $79,492.91 5.1%
Retire #Bets #Won %Won $Bet $Profit %ROI
1 92 29 31.5% $15,231.53 -$3,054.57 -20.1%
0 9600 4069 42.4% $1,514,310.56 $85,275.43 5.6%
-1 176 79 44.9% $36,606.30 -$2,727.95 -7.5%
TOTAL 9868 4177 42.3% $1,566,148.40 $79,492.91 5.1%
LossRetire #Bets #Won %Won $Bet $Profit %ROI
1 420 183 43.6% $78,125.39 $1,166.83 1.5%
0 9043 3820 42.2% $1,416,602.14 $76,547.49 5.4%
-1 405 174 43.0% $71,420.86 $1,778.58 2.5%
TOTAL 9868 4177 42.3% $1,566,148.40 $79,492.91 5.1%

Thanks for the great analysis Jon.
The statement “Well, all these variables are in the model, and hence the model has accurately calculated the value of each one.” – does this mean that the probs of players with an injury rating are now reduced so it’s now ok to bet on them?
If not, is there a way we can establish if a player has an injuy rating so we can manually decide not bet on them.
Yes thats right Jason, a players probability will decrease if they fit into the injury categories above.