ATP Profits by month
 The ATP tennis season is about to start once again, and we thought we’d analyse how well the model has gone by month. There have been suggestions that the model has done better earlier in the tennis season and faded away a little bit at the end due to motivational issues. Is this the case? Well we thought we’d analyse it.
Shown below is a table of all results going back to the start of 2006, and the profits we have had per month. Whilst the table shows some good info, it might be easier to see on the following two graphs, which look at profit per month and %ROI per month. Analysis to follow
| Month | #Bets | #Wins | %Wins | $Bet | $Profit | %ROI |
|---|---|---|---|---|---|---|
| 1 | 1025 | 484 | 47.2% | $213,638.99 | $15,042.10 | 7.0% |
| 2 | 980 | 433 | 44.2% | $183,734.47 | $1,707.87 | 0.9% |
| 3 | 668 | 271 | 40.6% | $99,585.56 | $10,065.98 | 10.1% |
| 4 | 911 | 429 | 47.1% | $171,893.82 | $10,101.33 | 5.9% |
| 5 | 981 | 477 | 48.6% | $203,191.69 | $17,729.16 | 8.7% |
| 6 | 898 | 443 | 49.3% | $196,677.09 | $13,789.31 | 7.0% |
| 7 | 1006 | 481 | 47.8% | $178,618.49 | $9,318.18 | 5.2% |
| 8 | 944 | 433 | 45.9% | $188,384.14 | $2,768.68 | 1.5% |
| 9 | 504 | 223 | 44.2% | $93,023.78 | $1,912.01 | 2.1% |
| 10 | 949 | 390 | 41.1% | $157,676.22 | $7,616.48 | 4.8% |
| 11 | 156 | 69 | 44.2% | $30,554.86 | $3,870.04 | 12.7% |
| 12 | 87 | 41 | 47.1% | $14,094.70 | $1,895.68 | 13.4% |
| 9109 | 4174 | 45.8% | $1,731,073.81 | $95,816.82 | 5.5% |
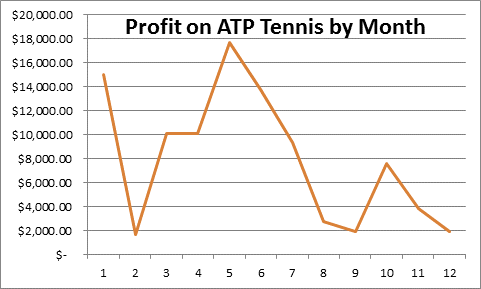
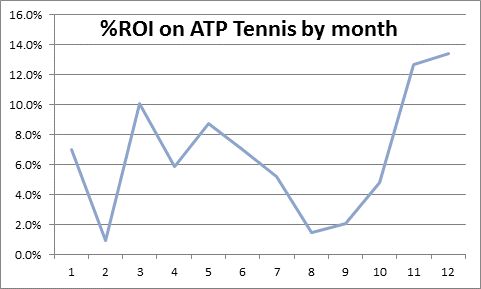
Clearly it shows that a large amount of the profit is made up in the first 7 months. In fact just over 80% of the profit has come from this. If you include month 12 as the start of the season (because the only ATP matches held in this time are ones just after Christmas – start of a new season), then the result is even more highlighted.
Apart from February, almost all months in this time have at least a $10,000 profit and significant %ROI over 5%. Then in months 8 and 9 (August and September), the profit drops off a but down to about 1-2% ROI before rebounding again for the end of season in October and November.
The amount of bets made in September is clearly less than other months, so this can highlight the issue around this time. What is interesting is that the US Open generally starts in late August, so it seems that the lead up matches to the US Open as well as post US Open matches, and perhaps the US Open itself, do not quite return the same amount as other months.
But given that, one could conclude that post Australian Open the same issues occur in February. Could this all be a motivation issue? There is a long way between drinks between the Australian open and the next major the French Open. Likewise, post US Open, apart from prize money, there might be little for some players in regards to motivation.
But then again, this could all just be random variation. Maybe it’s something to store in the back of the mind coming into the 2014 season.
2014 tennis subscriptions are available now. Get the details here: http://www.sportpunter.com/sports/tennis/
