NBA Sports Betting Model
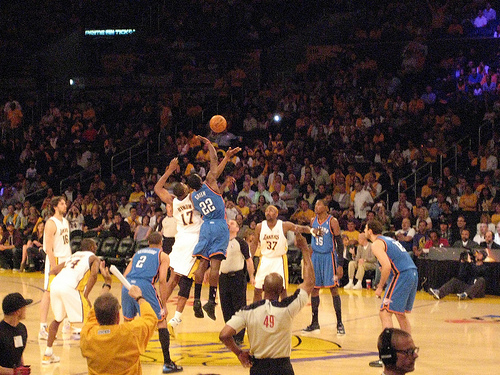 Sportpunter are about to release predictions for NBA with a brand new sports model.
NBA is one of the most bet sports in the world and with many games being played every day, the possibility of high turnover is great. Bookies will generally offer lines of 1.95 and better and liquidity isn’t regularly a major problem.
We have analysed the last 4 years of data using hold out samples of every year, and the following are the results. Keep in mind that this is the very early stages of the model. There are still plenty of other variables that we will be adding to it over the course of the season, but I’ve decided to release the predictions now as the season starts tonight (26/10/10).
And so now onto the analysis:
Line Betting
| Overlay | #Bets | #Won | %Won | $Bet | $Profit | %ROI | |
| 0 | 0.075 | 463 | 218 | 47.1% | $ 30,579.81 | -$ 2,670.33 | -8.7% |
| 0.075 | 0.1 | 411 | 196 | 47.7% | $ 37,544.81 | -$ 2,397.97 | -6.4% |
| 0.1 | 0.125 | 415 | 204 | 49.2% | $ 49,046.83 | -$ 1,630.20 | -3.3% |
| 0.125 | 0.15 | 363 | 173 | 47.7% | $ 52,293.83 | -$ 3,440.39 | -6.6% |
| 0.15 | 0.175 | 324 | 142 | 43.8% | $ 55,308.76 | -$ 7,361.34 | -13.3% |
| 0.175 | 0.2 | 271 | 151 | 55.7% | $ 53,334.85 | $ 4,682.80 | 8.8% |
| 0.2 | 0.25 | 482 | 245 | 50.8% | $ 113,096.65 | -$ 41.62 | 0.0% |
| 0.25 | 0.3 | 325 | 164 | 50.5% | $ 93,989.38 | -$ 952.13 | -1.0% |
| 0.3 | 0.4 | 333 | 169 | 50.8% | $ 120,960.89 | -$ 1,976.26 | -1.6% |
| 0.4 | 1 | 215 | 113 | 52.6% | $ 107,136.50 | $ 2,569.09 | 2.4% |
| 3602 | 1775 | 49.3% | $ 713,292.32 | -$ 13,218.34 | -1.9% |
So not that great results. However with a minimum 17.5% overlay a 0.9% ROI was made. But still a small profit.
Shown below is match number for line betting:
| Match# | #Bets | #Won | %Won | $Bet | $Profit | %ROI | |
| 0 | 10 | 723 | 687 | 95.0% | $ 16,417.84 | -$ 1,118.60 | -6.8% |
| 10 | 20 | 479 | 254 | 53.0% | $ 101,078.79 | $ 2,644.10 | 2.6% |
| 20 | 30 | 453 | 256 | 56.5% | $ 91,347.35 | $ 5,119.21 | 5.6% |
| 30 | 40 | 436 | 214 | 49.1% | $ 82,024.54 | -$ 2,254.54 | -2.7% |
| 40 | 50 | 400 | 203 | 50.8% | $ 70,212.27 | -$ 2,386.61 | -3.4% |
| 50 | 60 | 411 | 219 | 53.3% | $ 71,438.12 | -$ 850.71 | -1.2% |
| 60 | 70 | 428 | 197 | 46.0% | $ 73,903.51 | -$ 7,315.95 | -9.9% |
| 70 | 80 | 436 | 238 | 54.6% | $ 69,936.70 | -$ 1,993.13 | -2.8% |
| 80 | 90 | 448 | 236 | 52.7% | $ 89,485.02 | $ 1,148.05 | 1.3% |
| 90 | 5000 | 340 | 223 | 65.6% | $ 47,448.16 | -$ 6,210.17 | -13.1% |
| 4554 | 2727 | 59.9% | $ 713,292.32 | -$ 13,218.34 | -1.9% | ||
So early matches is does well, whilst struggling from match 30 (of each team) and onwards. Using a 17.5% ROI min. overlay this is shown below
| Match#, Overlay>=0.175 | #Bets | #Won | %Won | $Bet | $Profit | %ROI | |
| 0 | 10 | 35 | 17 | 48.6% | $ 11,991.91 | -$ 802.19 | -6.7% |
| 10 | 20 | 236 | 128 | 54.2% | $ 75,562.74 | $ 4,164.97 | 5.5% |
| 20 | 30 | 222 | 121 | 54.5% | $ 67,222.83 | $ 3,491.21 | 5.2% |
| 30 | 40 | 186 | 100 | 53.8% | $ 55,030.50 | $ 1,811.21 | 3.3% |
| 40 | 50 | 147 | 75 | 51.0% | $ 42,253.13 | -$ 552.74 | -1.3% |
| 50 | 60 | 163 | 84 | 51.5% | $ 46,545.70 | $ 479.45 | 1.0% |
| 60 | 70 | 166 | 77 | 46.4% | $ 45,366.55 | -$ 3,476.44 | -7.7% |
| 70 | 80 | 155 | 84 | 54.2% | $ 43,973.47 | $ 1,267.82 | 2.9% |
| 80 | 90 | 198 | 104 | 52.5% | $ 65,387.43 | $ 3,750.64 | 5.7% |
| 90 | 5000 | 118 | 52 | 44.1% | $ 35,184.01 | -$ 5,852.05 | -16.6% |
| 1626 | 842 | 51.8% | $ 488,518.27 | $ 4,281.89 | 0.9% | ||
This shows better results, and reasonable profits throughout the season until the final matches. Presumably, these are the playoffs where it doesn’t do as well. So it makes 2.2% ROI without the final end of the season. I’m not sure however as this stage, why this is the case.
TOTALS
| Overlay | #Bets | #Won | %Won | $Bet | $Profit | %ROI | |
| 0 | 0.075 | 507 | 247 | 48.7% | $ 33,237.67 | -$ 1,282.57 | -3.9% |
| 0.075 | 0.1 | 454 | 218 | 48.0% | $ 41,579.86 | -$ 1,827.24 | -4.4% |
| 0.1 | 0.125 | 388 | 195 | 50.3% | $ 45,877.17 | -$ 890.34 | -1.9% |
| 0.125 | 0.15 | 415 | 218 | 52.5% | $ 60,085.24 | $ 2,303.57 | 3.8% |
| 0.15 | 0.175 | 332 | 148 | 44.6% | $ 56,212.59 | -$ 6,722.61 | -12.0% |
| 0.175 | 0.2 | 288 | 149 | 51.7% | $ 56,821.42 | $ 2,390.14 | 4.2% |
| 0.2 | 0.25 | 438 | 225 | 51.4% | $ 102,933.24 | $ 2,437.00 | 2.4% |
| 0.25 | 0.3 | 280 | 149 | 53.2% | $ 80,059.75 | $ 4,300.85 | 5.4% |
| 0.3 | 0.4 | 257 | 137 | 53.3% | $ 92,639.37 | $ 5,186.56 | 5.6% |
| 0.4 | 1 | 118 | 62 | 52.5% | $ 60,841.90 | $ 3,144.00 | 5.2% |
| 3477 | 1748 | 50.3% | $ 630,288.21 | $ 9,039.36 | 1.4% |
Better results with totals, with 1.4% ROI being made, and a 4.4% ROI being made with overlays 17.5%+ which equates to about 345 bets a year.
| Match# | #Bets | #Won | %Won | $Bet | $Profit | %ROI | |
| 0 | 10 | 731 | 691 | 94.5% | $ 18,563.54 | -$ 654.80 | -3.5% |
| 10 | 20 | 464 | 260 | 56.0% | $ 100,121.97 | $ 11,777.17 | 11.8% |
| 20 | 30 | 413 | 220 | 53.3% | $ 73,884.28 | $ 4,041.46 | 5.5% |
| 30 | 40 | 400 | 193 | 48.3% | $ 69,437.21 | -$ 470.12 | -0.7% |
| 40 | 50 | 400 | 197 | 49.3% | $ 74,868.48 | $ 741.11 | 1.0% |
| 50 | 60 | 403 | 199 | 49.4% | $ 67,550.22 | $ 2,126.65 | 3.1% |
| 60 | 70 | 385 | 196 | 50.9% | $ 66,644.49 | -$ 997.44 | -1.5% |
| 70 | 80 | 417 | 220 | 52.8% | $ 66,179.22 | -$ 1,887.76 | -2.9% |
| 80 | 90 | 415 | 211 | 50.8% | $ 63,349.98 | -$ 4,580.94 | -7.2% |
| 90 | 5000 | 320 | 207 | 64.7% | $ 36,933.73 | -$ 1,664.59 | -4.5% |
| 4348 | 2594 | 59.7% | $ 637,533.11 | $ 8,430.73 | 1.3% |
Results show great results early, with great profits being made up to around match 60, 2/3rds of the year. Results drop off in the latter half of the season, similar to line betting. With min 17.5%+ overlay as shown below, results are improved a little and a profit was even made for betting in the playoffs. I don’t think one can read too much into below because of the smaller sample size, but results for totals seems promising.
| Match#, Overlay>=0.175 | #Bets | #Won | %Won | $Bet | $Profit | %ROI | |
| 0 | 10 | 45 | 23 | 51.1% | $ 14,328.68 | -$ 658.90 | -4.6% |
| 10 | 20 | 234 | 135 | 57.7% | $ 73,876.11 | $ 10,425.28 | 14.1% |
| 20 | 30 | 168 | 88 | 52.4% | $ 46,446.51 | $ 3,509.33 | 7.6% |
| 30 | 40 | 144 | 72 | 50.0% | $ 39,222.07 | $ 405.70 | 1.0% |
| 40 | 50 | 167 | 90 | 53.9% | $ 48,856.41 | $ 2,866.70 | 5.9% |
| 50 | 60 | 142 | 83 | 58.5% | $ 38,072.68 | $ 5,520.38 | 14.5% |
| 60 | 70 | 144 | 68 | 47.2% | $ 39,584.95 | -$ 2,141.00 | -5.4% |
| 70 | 80 | 137 | 66 | 48.2% | $ 37,877.87 | -$ 842.00 | -2.2% |
| 80 | 90 | 130 | 63 | 48.5% | $ 35,048.44 | -$ 1,940.56 | -5.5% |
| 90 | 5000 | 84 | 42 | 50.0% | $ 23,973.62 | $ 647.61 | 2.7% |
| 1395 | 730 | 52.3% | $ 397,287.34 | $ 17,792.54 | 4.5% | ||

NBA predictions will probably start around mid next week
predictions now up. Probabilities available from the download of this calc:
http://www.sportpunter.com/basketball/nba/nbacalc.xls
Are there any forums about this that I could go to?
yes the sportpunter forum!: http://www.sportpunter.com/forum
Very interesting points you have observed , thankyou for putting up.