
 The 2017 AFL Season is fast approaching and once again Sportpunter will be providing predictions.
Last year might have been a sour one, but we will show in the analysis below how we expect to go in 2017.
If you look at the bigger picture, we have made 12.1% ROI from line betting in the last 12 years and 10.3% ROI in the last five years. With only about 140 bets per year there’s bound to be year to year variation in results.
In fact, we’ve even done a simulation of potential profits. Given an average line bet size of $190 (as per average bet size of past 10 years), and a random amount bet from as low as $50 up to $329, and 140 bets per year. We simulated the season based on the fact that we have a 10% ROI and a 5% ROI respectively. The graph below shows both. So even with a 10% ROI, over 140 bets there is still a very good chance that we would have a losing year. The graphs show 50,000 simulations and the %ROI that we received after each one.
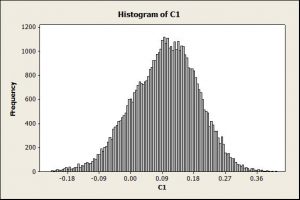
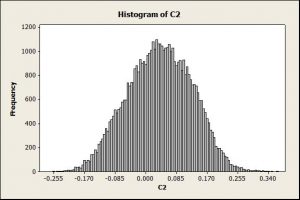
That just goes to show that, even with a big edge, random variation still plays its part, and as a successful punter, one has to consider this as part of your own personal betting strategy. A live example of random variation can be seen in the NRL model in the last 3 years where a player based model was implemented. In 2014 we made 10.9% ROI followed by only 0.2% ROI the next year and then 13.1% ROI in 2016. (Subscriptions is open for rugby league here)
Interestingly as well though, the average bet size for line betting has decreased a little over the years. Bet sizes increased considerably in 2011 to 2014, around the time we implemented a player based model, however the last two years the average bet size has been considerably lower. Whilst this is only a smaller sample size of 2 years, it could be noted that there could be a reason behind it.
Bet size, using the Kelly method can only be larger due to smaller odds or larger overlays. Whilst betting on the line the odds are kept moderately consistent, the only way where bet size is
smaller if the overlays are smaller.
This can only happen if the market has become more efficient. Perhaps the bookies are pricing up smarter odds, perhaps the odds have been backed in earlier, perhaps the smaller bet size is just random variation. Either way, it’s something for punters to take note of.
That said, there are still plenty of good signs coming up for the 2017 AFL Model, and I’m looking forward to sharing the profits that the last 18 years have produced.
Betting histories and subscription details for the AFL are available here: http://www.sportpunter.com/sports/afl/
 With over ten years of live betting history on the net, and large profits almost every year, the Sportpunter AFL model is the best anywhere to be seen. More than 10% ROI had been made and is on sale now at the
  Sportpunter's tennis model has been one of the longest running. Operating since 2003 it has made around 5% ROI over the years. And with many matches being played, it is a model that tennis betting enthusiasts need behind them.
Pingback: AFL is back thursday - Daily25 Betting Blog
Hi Jonno,
Do you think your model still has an edge on the market? I note with interest your comment about bookies maybe becoming smarter (or other models getting in earlier) and wonder if the good times are over?
Thanks
one year of bad results, preceeded by 7 years in a row of 6% to 23% POTS. I dont think we can look too harshly on one season. We had a bad year in 2006 as well, but bounced back to record profits for the next 7 years. So yes, there’s plenty of value left imo
How do you calculate your overlay percentage, what is the implied probaility of your fair value and how is that claculated aganst the actual market ps line?
overlay = Probability * Odds – 1
great and how do you work out your adjusted line probabilty for comparison with the actual market line probabilty?
mathematics 🙂